This page shows you how to export logs and metrics from an attached cluster to Cloud Logging and Cloud Monitoring.
How it works
Google Cloud Observability is the built-in observability solution for Google Cloud. To export cluster-level telemetry from an attached cluster into Google Cloud, you need to deploy the following open source export agents into your cluster:
- Stackdriver Log Aggregator (stackdriver-log-aggregator-*). A Fluentd StatefulSet that sends logs to the Cloud Logging (formerly Stackdriver Logging) API.
- Stackdriver Log Forwarder (stackdriver-log-forwarder-*). A Fluentbit daemonset that forwards logs from each Kubernetes node to the Stackdriver Log Aggregator.
- Stackdriver Metrics Collector (stackdriver-prometheus-k8s-*). A Prometheus StatefulSet, configured with a stackdriver export sidecar container, to send Prometheus metrics to the Cloud Monitoring (formerly Stackdriver Monitoring) API. The sidecar is another container inside the same pod which reads the metrics which the prometheus server stores on disk and forwards them to the Cloud Monitoring API.
Prerequisites
A Google Cloud project with billing enabled. See our pricing guide to learn about Cloud Operations costs.
One attached cluster, registered using this guide. Run the following command to verify that your cluster is registered.
gcloud container fleet memberships list
Example output:
NAME  EXTERNAL_ID
eks   ae7b76b8-7922-42e9-89cd-e46bb8c4ffe4
A local environment from which you can access your cluster and run
kubectlcommands. See the GKE quickstart for instructions on how to installkubectlthrough gcloud. Run the following command to verify that you can reach your attached cluster usingkubectl.kubectl cluster-info
Example output:
Kubernetes master is running at https://[redacted].gr7.us-east-2.eks.amazonaws.com
Setup
Clone the sample repository and navigate into the directory for this guide.
git clone https://github.com/GoogleCloudPlatform/anthos-samples
cd anthos-samples/attached-logging-monitoring
Set the project ID variable to the project where you've registered your cluster.
PROJECT_ID="your-project-id"
Create a Google Cloud service account with permissions to write metrics and logs to the Cloud Monitoring and Cloud Logging APIs. You'll add this service account's key to the workloads deployed in the next section.
gcloud iam service-accounts create anthos-lm-forwarder

gcloud projects add-iam-policy-binding $PROJECT_ID \
--member="serviceAccount:anthos-lm-forwarder@${PROJECT_ID}.iam.gserviceaccount.com" \
  --role=roles/logging.logWriter

gcloud projects add-iam-policy-binding $PROJECT_ID \
--member="serviceAccount:anthos-lm-forwarder@${PROJECT_ID}.iam.gserviceaccount.com" \
  --role=roles/monitoring.metricWriter
Create and download a JSON key for the service account you just created, then create a Kubernetes secret in your cluster using that key.
gcloud iam service-accounts keys create credentials.json \
--iam-account anthos-lm-forwarder@${PROJECT_ID}.iam.gserviceaccount.com

kubectl create secret generic google-cloud-credentials -n kube-system --from-file credentials.json
Installing the logging agent
Change into the
logging/directory.cd logging/
Open
aggregator.yaml. At the bottom of the file, set the following variables to the value corresponding to your project and cluster:project_id [PROJECT_ID] k8s_cluster_name [CLUSTER_NAME] k8s_cluster_location [CLUSTER_LOCATION]
You can find your cluster location by running the following command with your attached cluster's membership name, and getting the location that appears at
/locations/<location>.gcloud container fleet memberships describe eks | grep name
Output:
name: projects/my-project/locations/global/memberships/eks
In
aggregator.yaml, undervolumeClaimTemplates/spec, specify the PersistentVolumeClaimstorageClassNamefor your cluster: we have provided default values for EKS and AKS for you to uncomment as appropriate. If you are using EKS, this isgp2. For AKS, this isdefault.If you have configured a custom Kubernetes Storage Class in AWS or Azure, want to use a non-default storage class, or are using another conformant cluster type, you can add your own
storageClassName. The appropriatestorageClassNameis based on the type of PersistentVolume (PV) that has been provisioned by an administrator for the cluster usingStorageClass. You can find out more about storage classes and the default storage classes for other major Kubernetes providers in the Kubernetes documentation.# storageClassName: standard #Google Cloud # storageClassName: gp2 #AWS EKS # storageClassName: default #Azure AKS
Deploy the log aggregator and forwarder to the cluster.
kubectl apply -f aggregator.yaml
kubectl apply -f forwarder.yaml
Verify that the pods have started up. You should see 2 aggregator pods, and one forwarder pod per Kubernetes worker node. For instance, in a 4-node cluster, you should expect to see 4 forwarder pods.
kubectl get pods -n kube-system | grep stackdriver-log
Output:
stackdriver-log-aggregator-0                 1/1     Running   0          139m
stackdriver-log-aggregator-1                 1/1     Running   0          139m
stackdriver-log-forwarder-2vlxb              1/1     Running   0          139m
stackdriver-log-forwarder-dwgb7              1/1     Running   0          139m
stackdriver-log-forwarder-rfrdk              1/1     Running   0          139m
stackdriver-log-forwarder-sqz7b              1/1     Running   0          139m
Get aggregator logs and verify that logs are being sent to Google Cloud.
kubectl logs stackdriver-log-aggregator-0 -n kube-system
Output:
2020-10-12 14:35:40 +0000 [info]: #3 [google_cloud] Successfully sent gRPC to Stackdriver Logging API.
Deploy a test application to your cluster. This is a basic HTTP web server with a loadgenerator.
kubectl apply -f  https://raw.githubusercontent.com/GoogleCloudPlatform/istio-samples/master/sample-apps/helloserver/server/server.yaml

kubectl apply -f https://raw.githubusercontent.com/GoogleCloudPlatform/istio-samples/master/sample-apps/helloserver/loadgen/loadgen.yaml
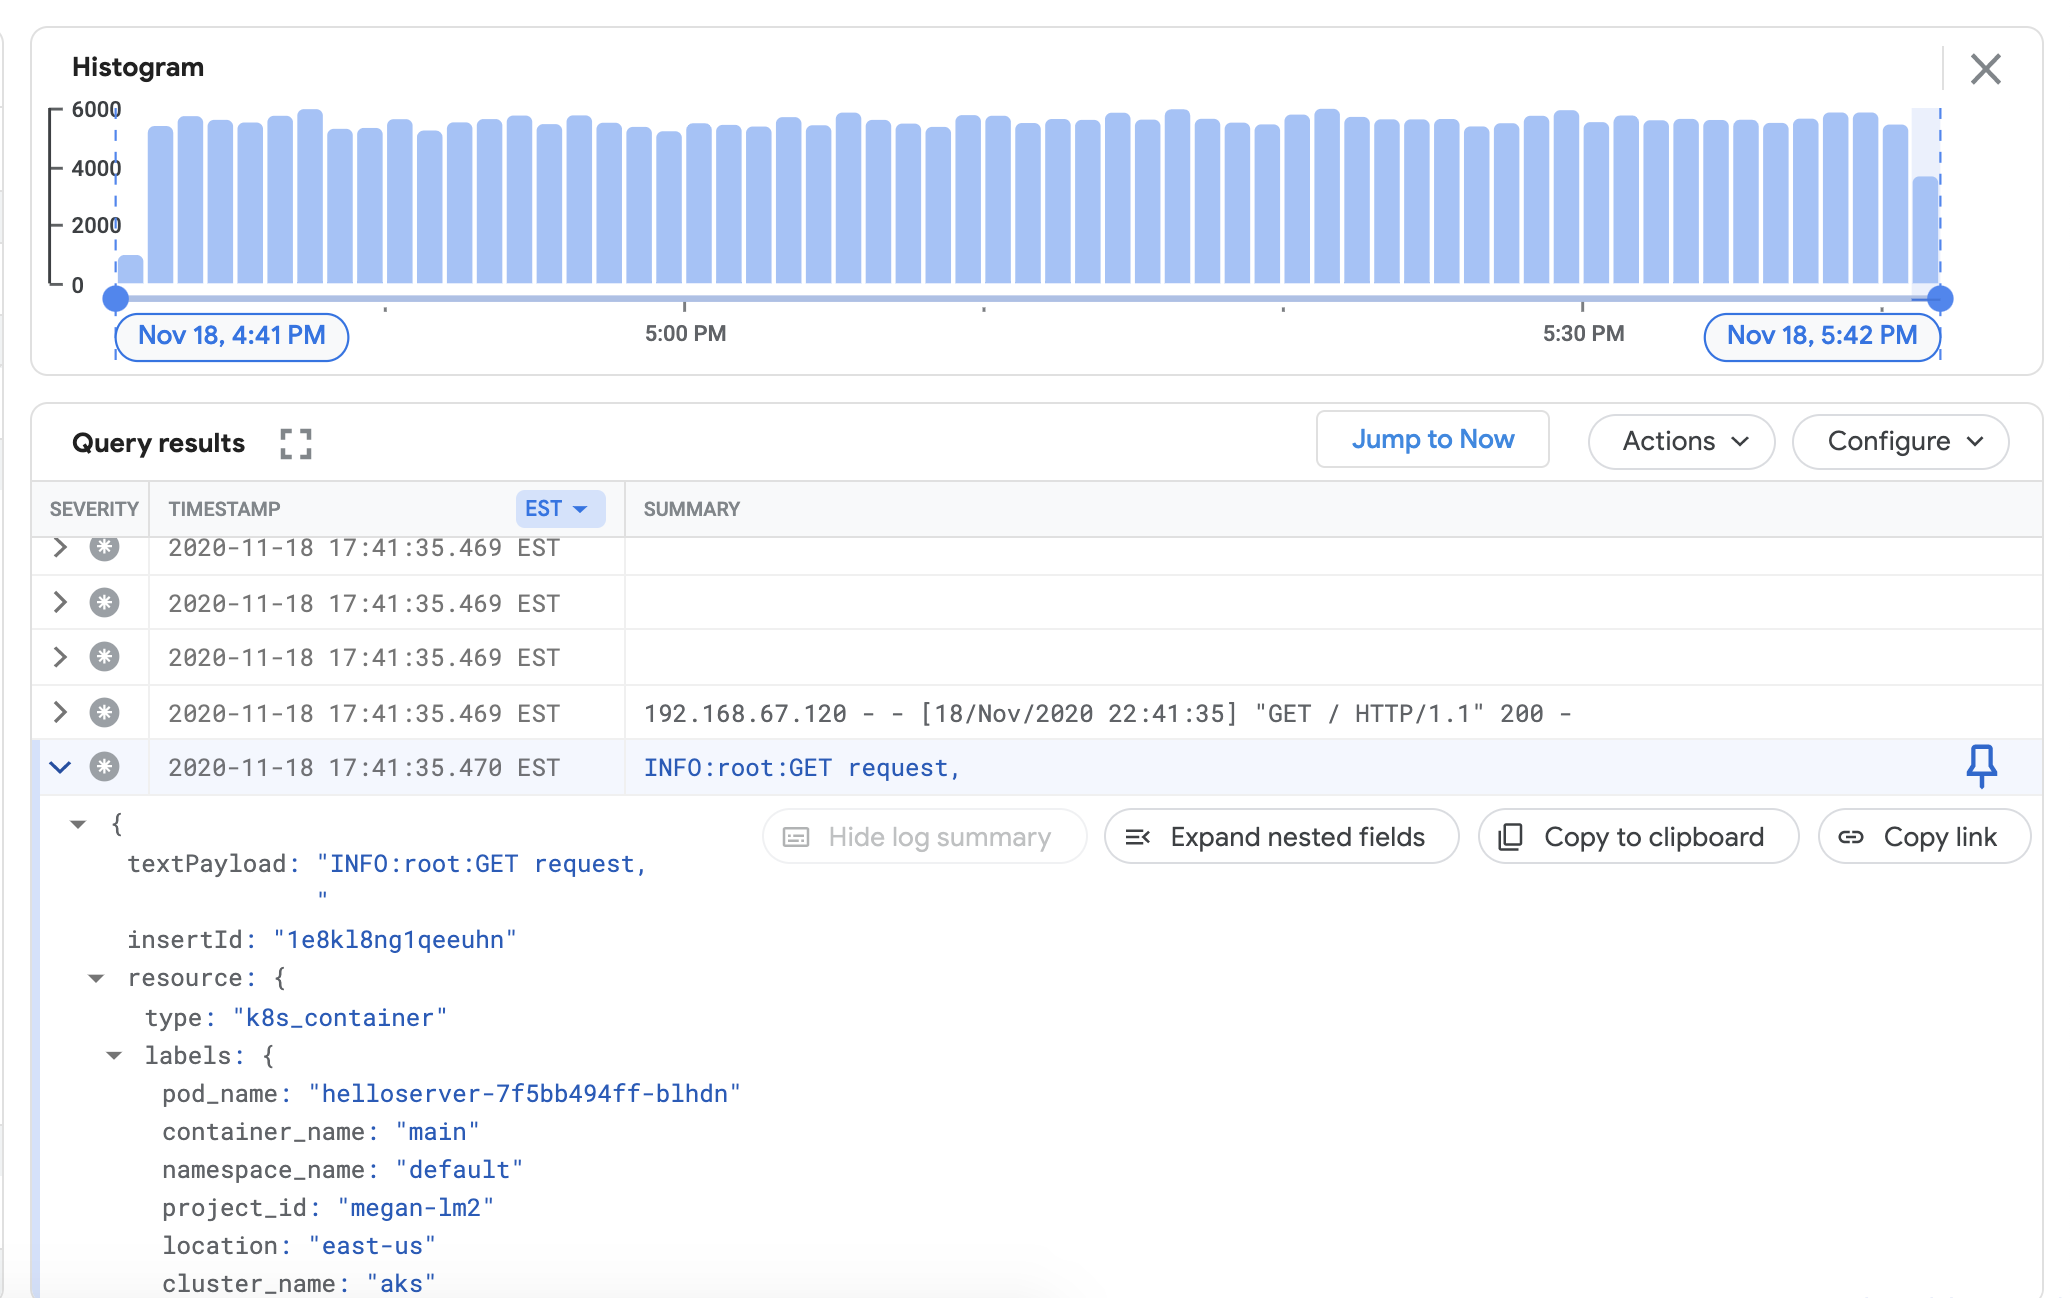
Verify that you can view logs from your attached cluster in the Cloud Logging dashboard. Go to the Logs Explorer in the Google Cloud console:
In the Logs Explorer, copy the sample query below into the Query builder field, replacing
${your-cluster-name}with your cluster name. Click Run query. You should see recent cluster logs appear under Query results.resource.type="k8s_container" resource.labels.cluster_name="${your-cluster-name}"

Installing the monitoring agent
Navigate out of the
logging/directory and into themonitoring/directory.cd ../monitoring
Open
prometheus.yaml. Understackdriver-prometheus-sidecar/args, set the following variables to match your environment."--stackdriver.project-id=[PROJECT_ID]" "--stackdriver.kubernetes.location=[CLUSTER_LOCATION]" "--stackdriver.generic.location=[CLUSTER_LOCATION]" "--stackdriver.kubernetes.cluster-name=[CLUSTER_NAME]"
From prometheus.yaml, under
volumeClaimTemplates/spec, uncomment thestorageClassNamethat matches your cloud provider, as described in Installing the logging agent.# storageClassName: standard #Google Cloud # storageClassName: gp2 #AWS EKS # storageClassName: default #Azure AKS
Deploy the stackdriver-prometheus StatefulSet, configured with the exporter sidecar, to your cluster.
kubectl apply -f server-configmap.yaml
kubectl apply -f sidecar-configmap.yaml
kubectl apply -f prometheus.yaml
Verify that the
stackdriver-prometheuspod is running.watch kubectl get pods -n kube-system | grep stackdriver-prometheus
stackdriver-prometheus-k8s-0 2/2 Running 0 5h24m
Get the Stackdriver Prometheus sidecar container logs to verify that the pod has started up.
kubectl logs stackdriver-prometheus-k8s-0 -n kube-system stackdriver-prometheus-sidecar
level=info ts=2020-11-18T21:37:24.819Z caller=main.go:598 msg="Web server started"
level=info ts=2020-11-18T21:37:24.819Z caller=main.go:579 msg="Stackdriver client started"
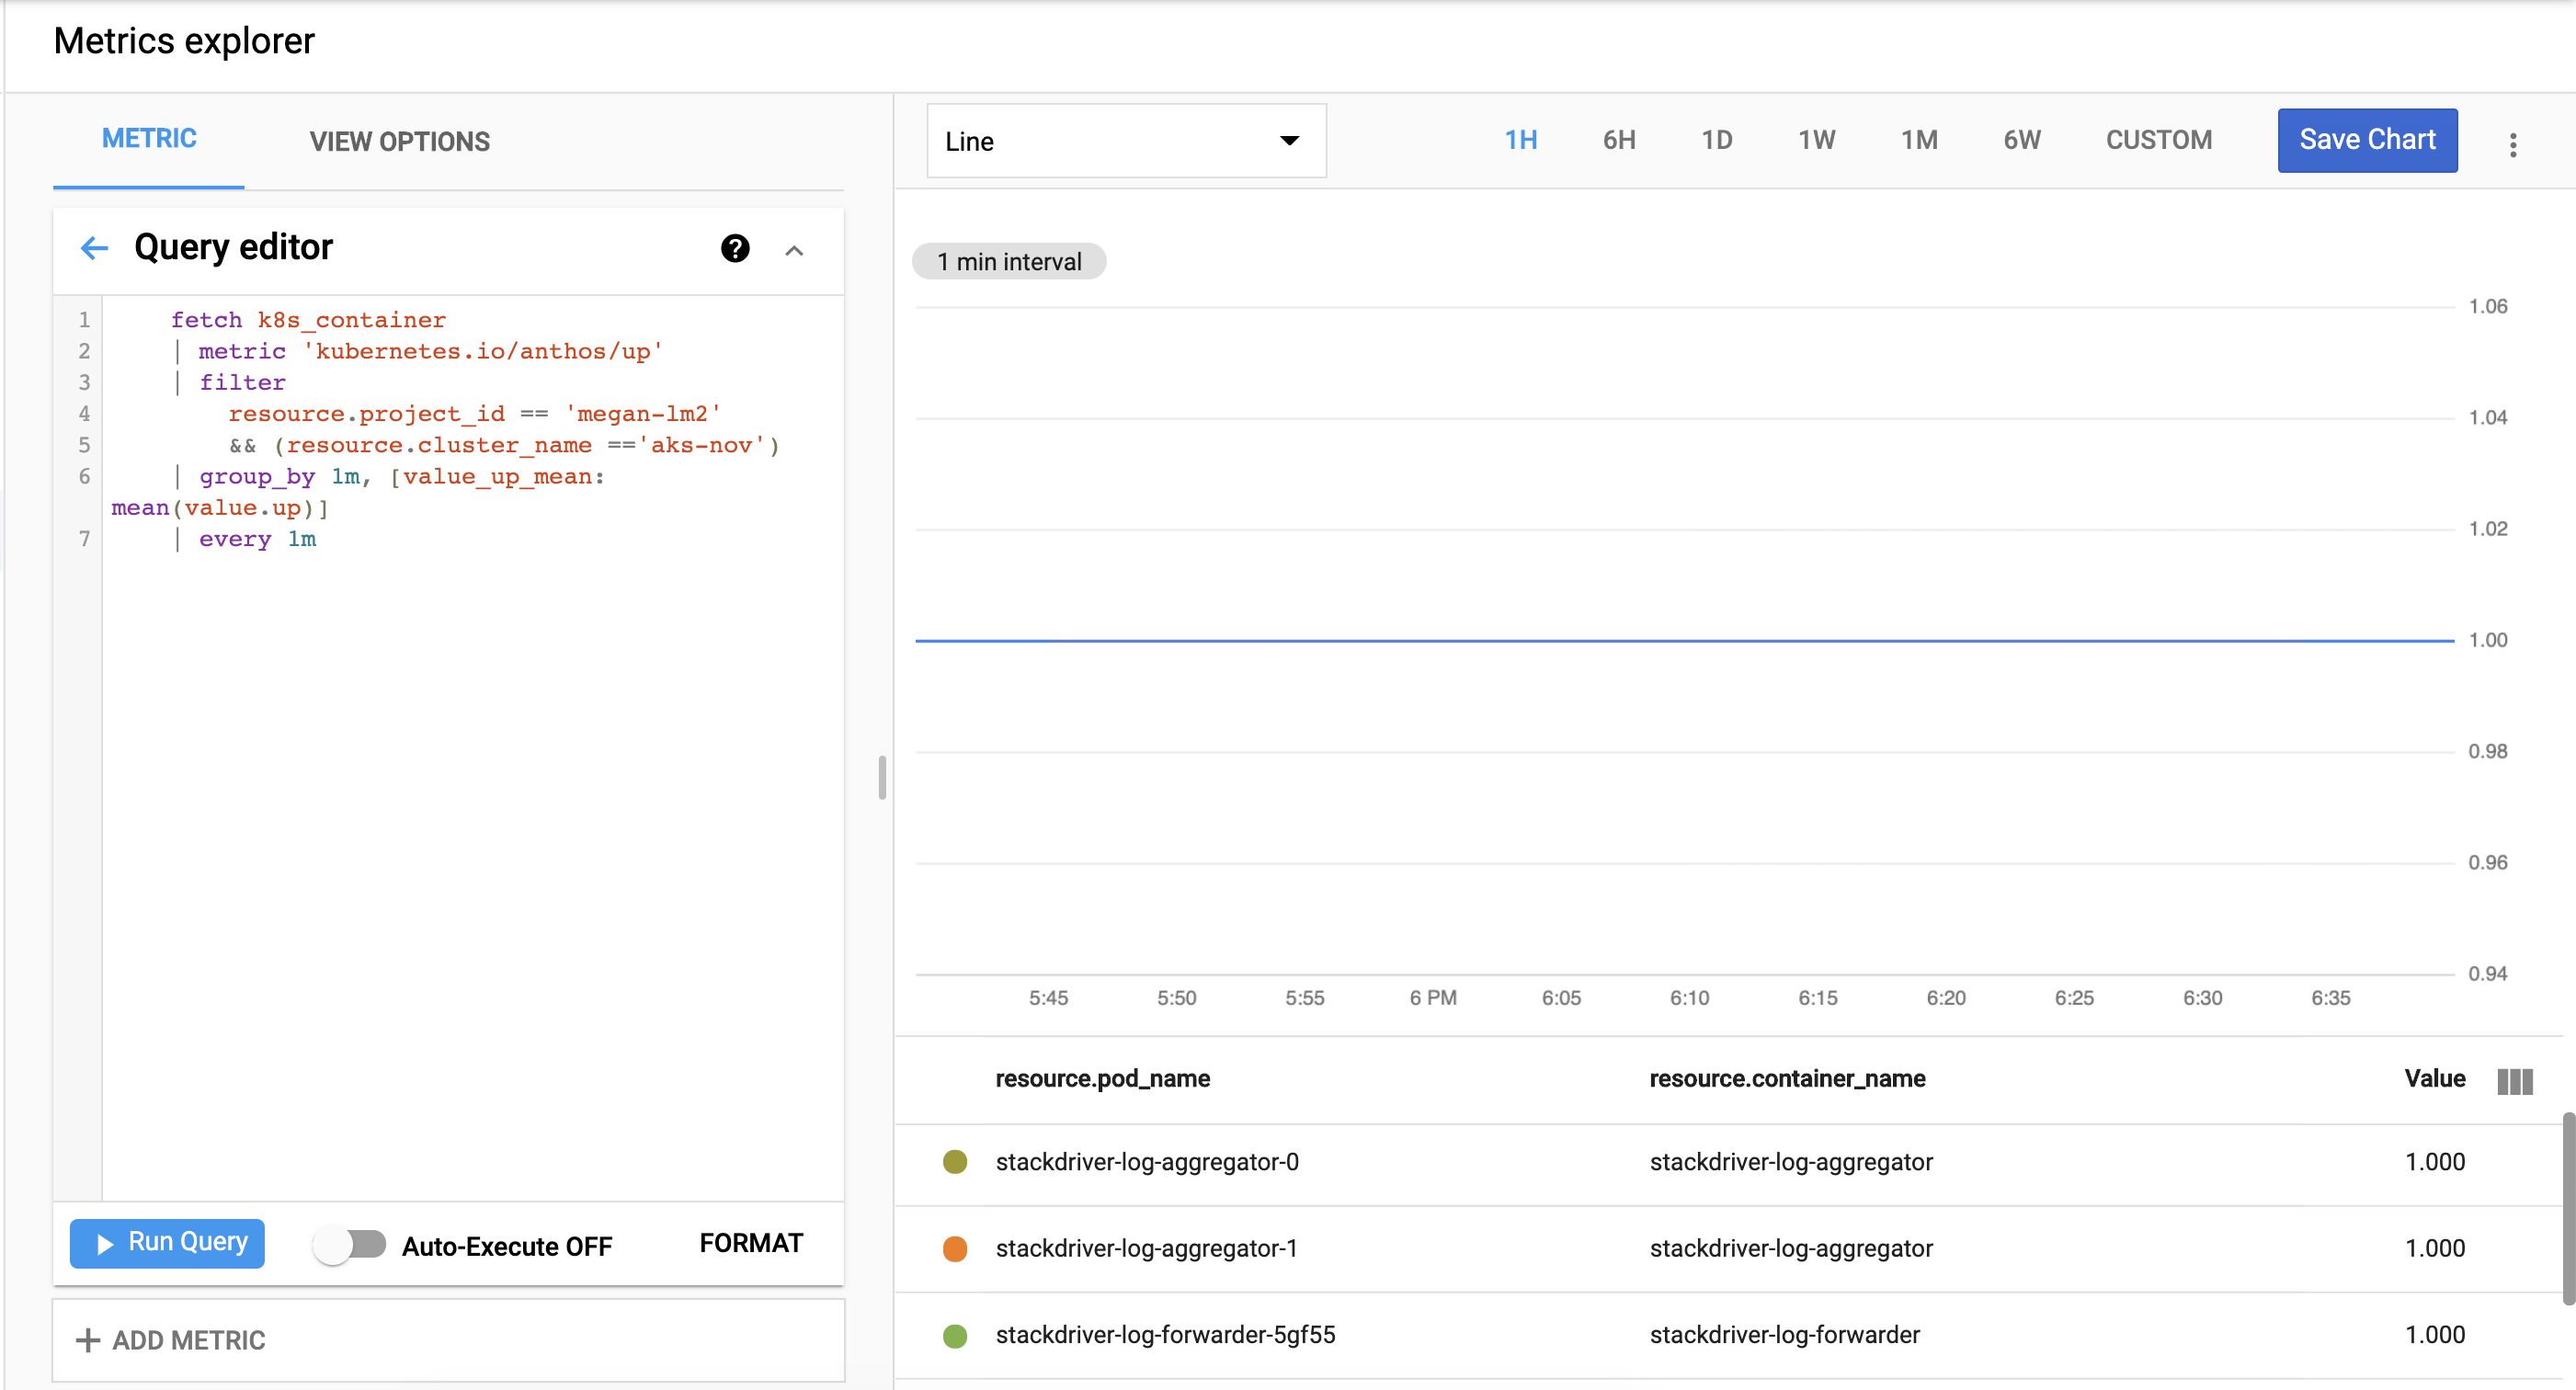
Verify that cluster metrics are exporting successfully to Cloud Monitoring. Go to the Metrics Explorer in the Google Cloud console:
Click Query editor, then copy in the following command, replacing
${your-project-id}and${your-cluster-name}with your own project and cluster information. Then click run query. You should see1.0.fetch k8s_container | metric 'kubernetes.io/anthos/up' | filter resource.project_id == '${your-project-id}' && (resource.cluster_name =='${your-cluster-name}') | group_by 1m, [value_up_mean: mean(value.up)] | every 1m

Clean up
To remove all the resources created in this guide:
kubectl delete -f logging
kubectl delete -f monitoring
kubectl delete secret google-cloud-credentials -n kube-system
kubectl delete -f https://raw.githubusercontent.com/GoogleCloudPlatform/istio-samples/master/sample-apps/helloserver/loadgen/loadgen.yaml
kubectl delete -f https://raw.githubusercontent.com/GoogleCloudPlatform/istio-samples/master/sample-apps/helloserver/server/server.yaml
rm -r credentials.json
gcloud compute service-accounts delete anthos-lm-forwarder
What's next?
Learn about Cloud Logging:
- Cloud Logging overview
- Using the Logs Explorer
- Building queries for Cloud Logging
- Create logs-based metrics
