Profile your model on Cloud TPU VMs
Profiling lets you optimize your model's training performance on Cloud TPUs. You use TensorBoard and the Cloud TPU TensorBoard plug-in to profile your model.
For more information about using TensorBoard with one of the supported frameworks, see the following documents:
Prerequisites to profiling a training script
Before you use the TPU profiling tools, you need to create a Cloud TPU, modify your training script, and start a model training session.
- Set up a v4-8 TPU to train a model. The profiling procedure described in this document uses a ResNet model, but you can use another model provided it trains on a v4 TPU.
In your TPU VM, add a line to start the profiler server to the training script.
For the ResNET training, the training script is at:
/usr/share/tpu/tensorflow/resnet50_keras/resnet50.py.Insert the highlighted lines into resnet50.py. At the top of the file, add the following import:
import tensorflow.compat.v2 as tf2
Right before the scripts starts the training loop, add the highlighted line:
if name == 'main':
    tf.logging.set_verbosity(tf.logging.INFO)
    tf2.profiler.experimental.server.start(6000)
    app.run(main)
The TensorFlow profiler server starts on your TPU VM when you run the script.
Start the model training.
Run your training script and wait until you see output indicating your model is actively training. The output depends on your code and model. Look for output like
Epoch 1/100. Alternatively, you can navigate to the Cloud TPU page in the Google Cloud console, select your TPU, and view the CPU utilization graph. While the CPU utilization graph does not show TPU utilization, it's a good indication that the TPU is training your model.
Start profiling the model training
When the model is training, open a separate terminal window or Cloud Shell. Use the following steps to begin profiling the model training.
In the new window or shell, connect to your TPU VM with port forwarding.
gcloud compute tpus tpu-vm ssh your-vm --zone=us-central2-b --ssh-flag="-4 -L 9001:localhost:9001"
Port forwarding allows your local browser to communicate with the TensorBoard server running on your TPU VM.
Install TensorFlow requirements.
Your TPU VM has TensorBoard installed by default. You can also install TensorFlow manually. Either way, some additional dependencies may be required. Install these dependencies on your TPU VM by running:
pip3 install -r /usr/share/tpu/models/official/requirements.txt
Install the Cloud TPU TensorBoard Plugin.
From the TPU VM, run the following commands:
 pip3 install --upgrade "cloud-tpu-profiler>=2.3.0"
 pip3 install tensorflow
 pip3 install tensorboard_plugin_profile
Start the TensorBoard server
Run TensorBoard and create a log directory (
logdir) on the TPU VM where TensorBoard can write profiling data. Specify the log directory using the--logdirflag. For example:mkdir log-directory TPU_LOAD_LIBRARY=0 tensorboard --logdir log-directory --port 9001
TensorBoard starts a web server and displays its URL:
Serving TensorBoard on localhost; to expose to the network, use a proxy or pass --bind_all
TensorBoard 2.3.0 at http://localhost:9001 (Press CTRL+C to quit)
Open a web browser and go to the URL displayed in the TensorBoard output. Select Profile from the drop-down menu in the upper right of the TensorBoard page. The list of available profiling tools is shown in the tools pulldown menu on the left sidebar.
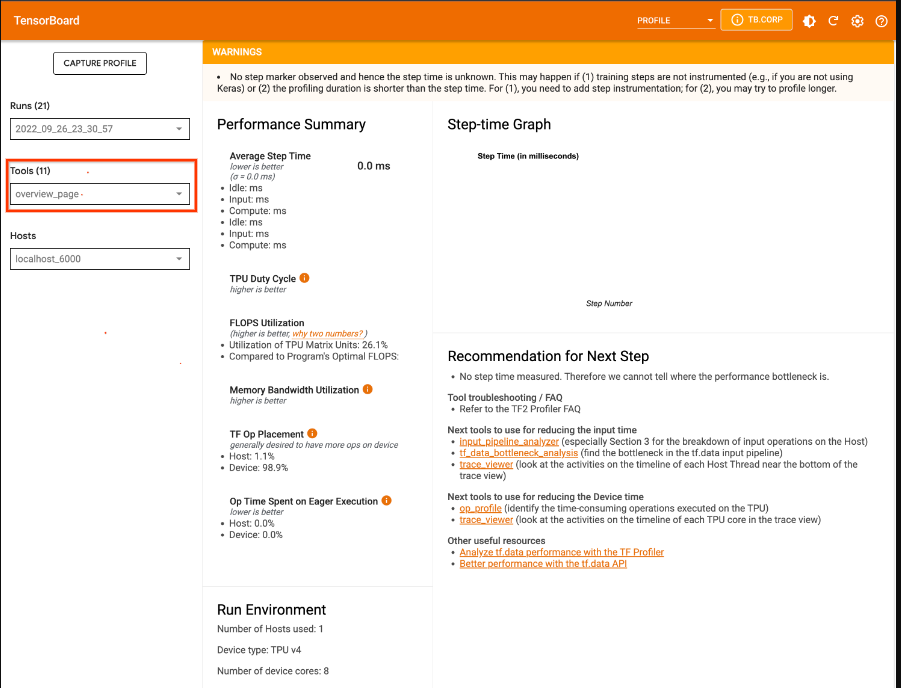
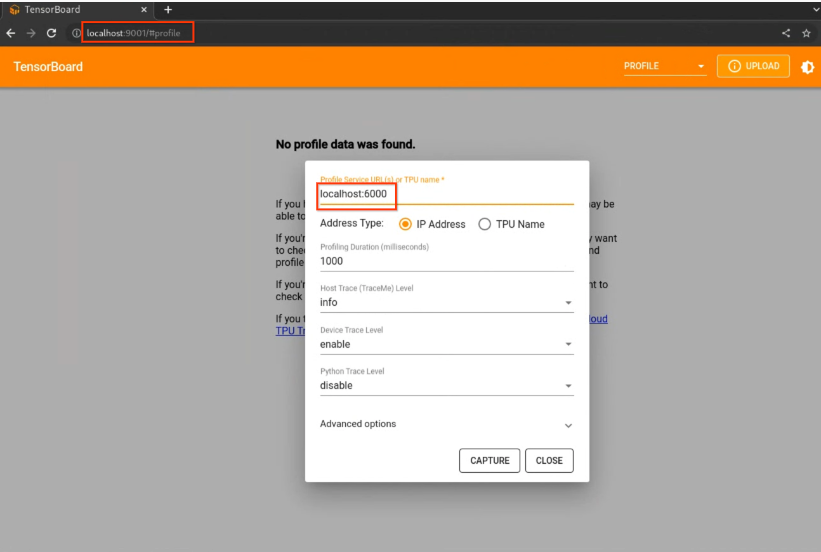
Capture a profile on TPU VMs
- Select the CAPTURE PROFILE button.
- Select the IP address radio button.
- Type HOSTNAME:6000 in the
Profile Service URLfield. - Select the CAPTURE button.
View profile data with TensorBoard
After you capture a profile, TensorBoard displays the overview page. The list of profiling tools you can use is displayed in the left pane.
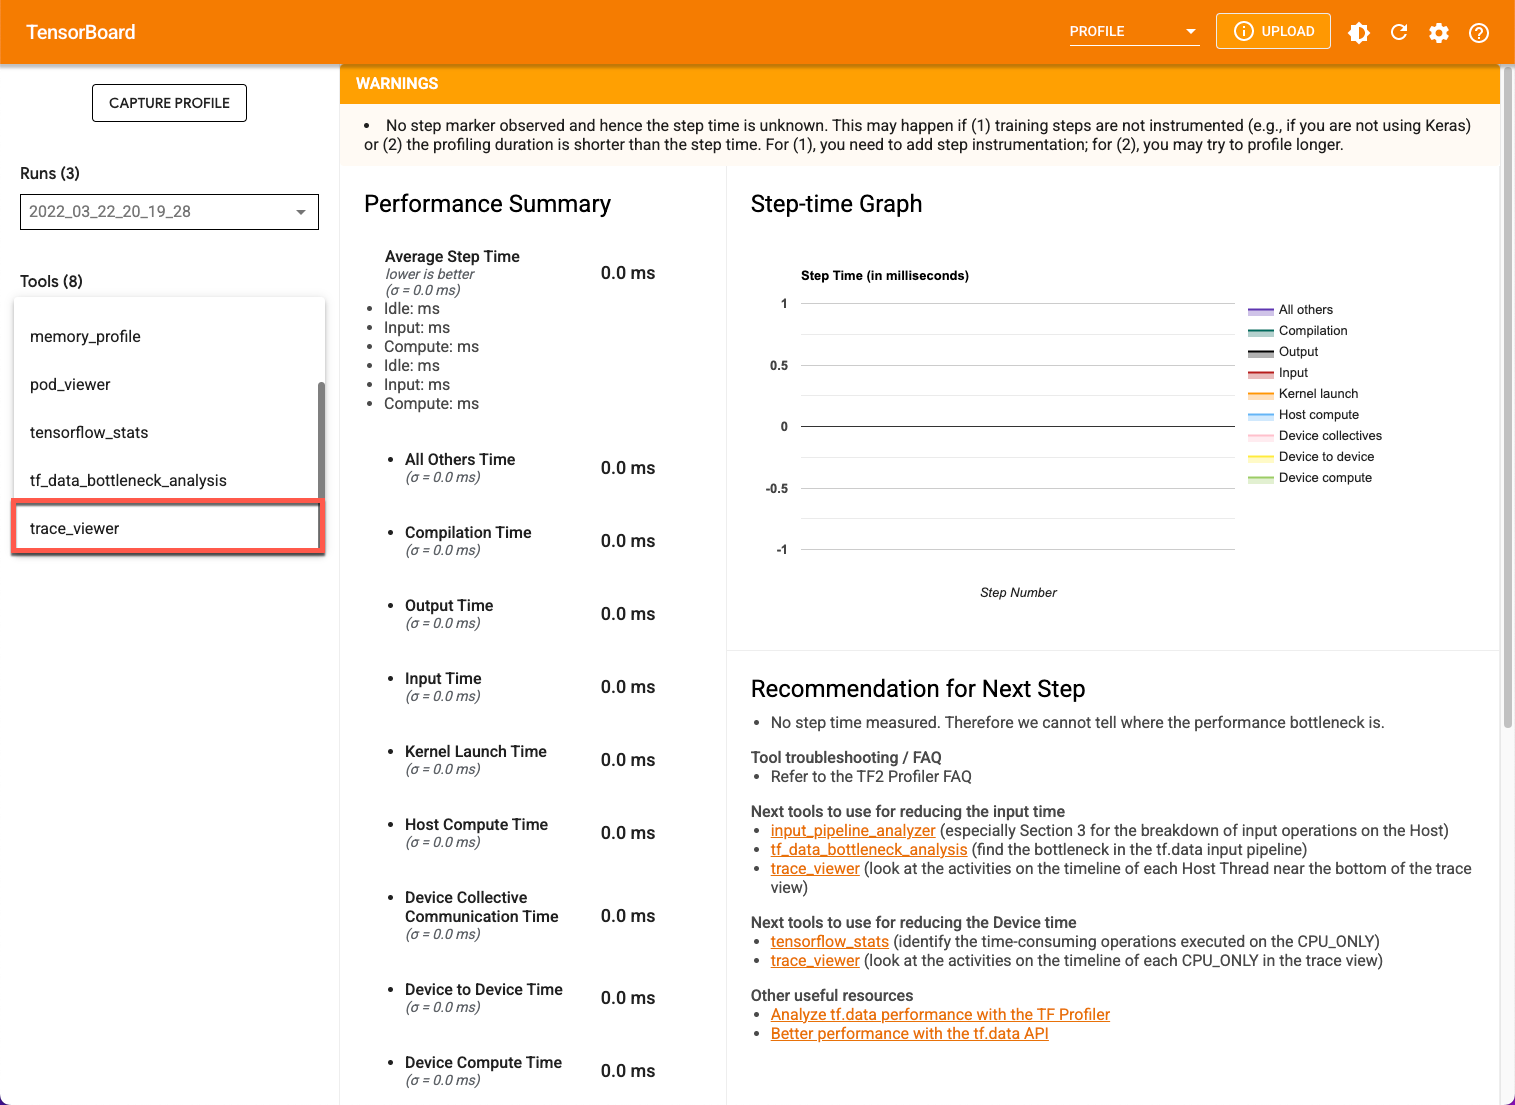
Profile
The Profile tab is displayed after you have captured some model data. You may need to click the refresh button on the TensorBoard page. Once data is available, clicking the Profile tab presents a selection of tools to help with performance analysis. You can use any of the following tools to profile your model.
- Overview page
- Input pipeline analyzer
- XLA Op profile
- Trace viewer (Chrome browser only)
- Memory viewer
Profile overview page
The overview page (overview_page), available in the Profile page, provides a top level view of how your model performed during a capture run. The page shows you an aggregated overview for all your TPUs and an overall input pipeline analysis. There is an option for selecting individual TPUs in the Host drop-down.
The page displays data in the following panels:
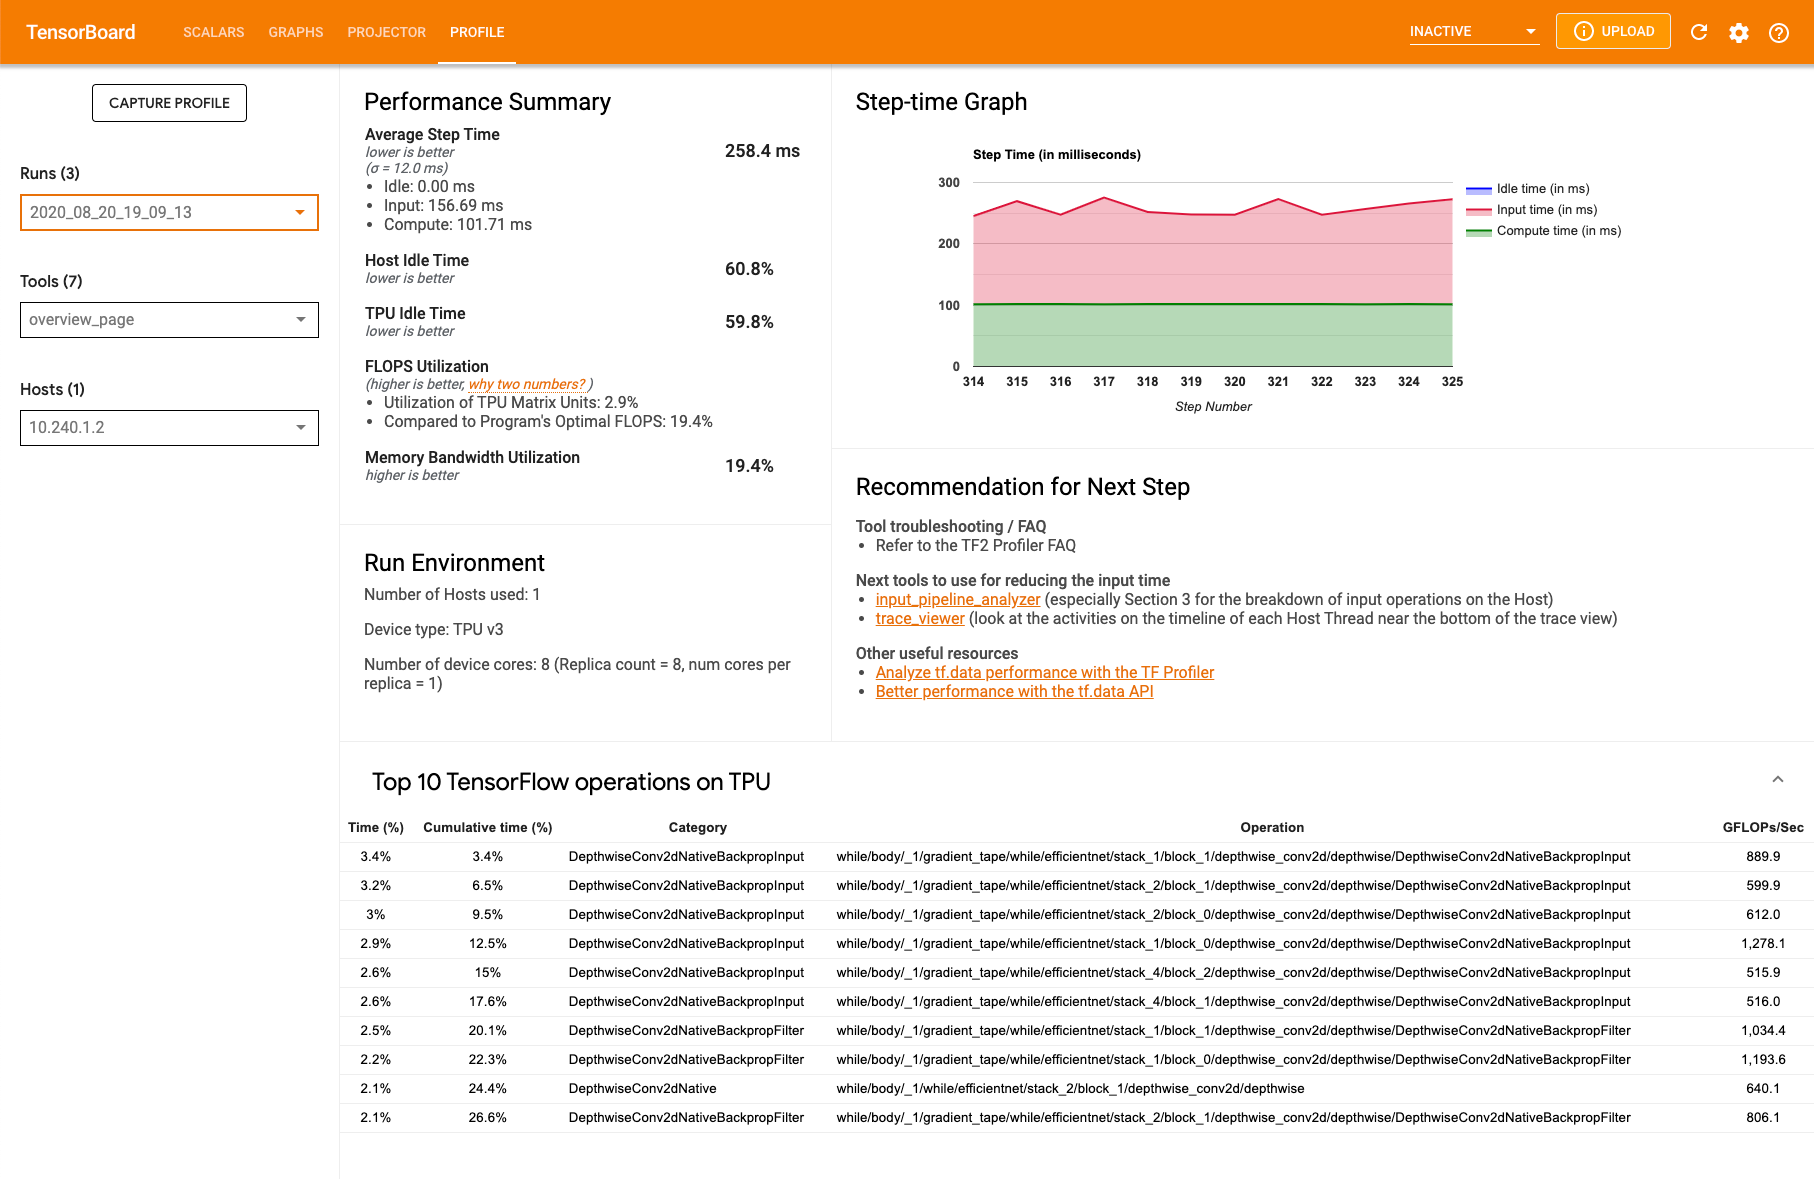
Performance summary
- FLOPS Utilization: The percentage utilization of the TPU matrix units
Top ten TensorFlow operations on TPU: Displays the TensorFlow operations that consumed the most time. Each row displays the self-time of an operation (as the percentage of time taken by all operations), cumulative time, category, name, and the FLOPS rate achieved.
Run environment
- The number of hosts used
- The type of TPU used
- The number of TPU cores
Input pipeline analyzer
The input pipeline analyzer provides insights into your performance results. The tool tells you immediately whether your program is input bound and can walk you through device and host-side analysis to debug whatever stage of the pipeline is creating bottlenecks.
See the guidance on input pipeline performance for deeper insight into optimizing pipeline performance.
Input pipeline
When a TensorFlow program reads data from a file, the read process is divided into multiple data processing stages connected in series. The output of one stage is the input to the next one. This system of reading is called the input pipeline.
A typical pipeline for reading records from files has the following stages:
- File reading
- File preprocessing (optional)
- File transfer from the host machine to the device
An inefficient input pipeline can severely slow down your application. An application is considered input bound when it spends a significant portion of time in its input pipeline. Use the Input pipeline analyzer to understand where the input pipeline is inefficient.
Input pipeline dashboard
To open the input pipeline analyzer, select Profile, then select input_pipeline_analyzer from the Tools drop-down.
The dashboard shows device-side and host-side analysis details.
Device-side analysis
This section shows details on device step times.
- Device step time statistics
- % of device step time waiting for input data
Host-side analysis
This section shows the details of host-side analysis broken into several categories:
- Enqueuing data to be transferred to device: Time spent putting data into an infeed queue before transferring the data to the device.
- Data preprocessing: Time spent on preprocessing operations, such as image decompression.
- Reading data from files in advance: Time spent reading files, including caching, prefetching, and interleaving.
- Reading data from files on demand: Time spent on reading data from files without caching, prefetching, and interleaving.
- Other data reading or processing: Time spent on other input related operations
not using
tf.data.
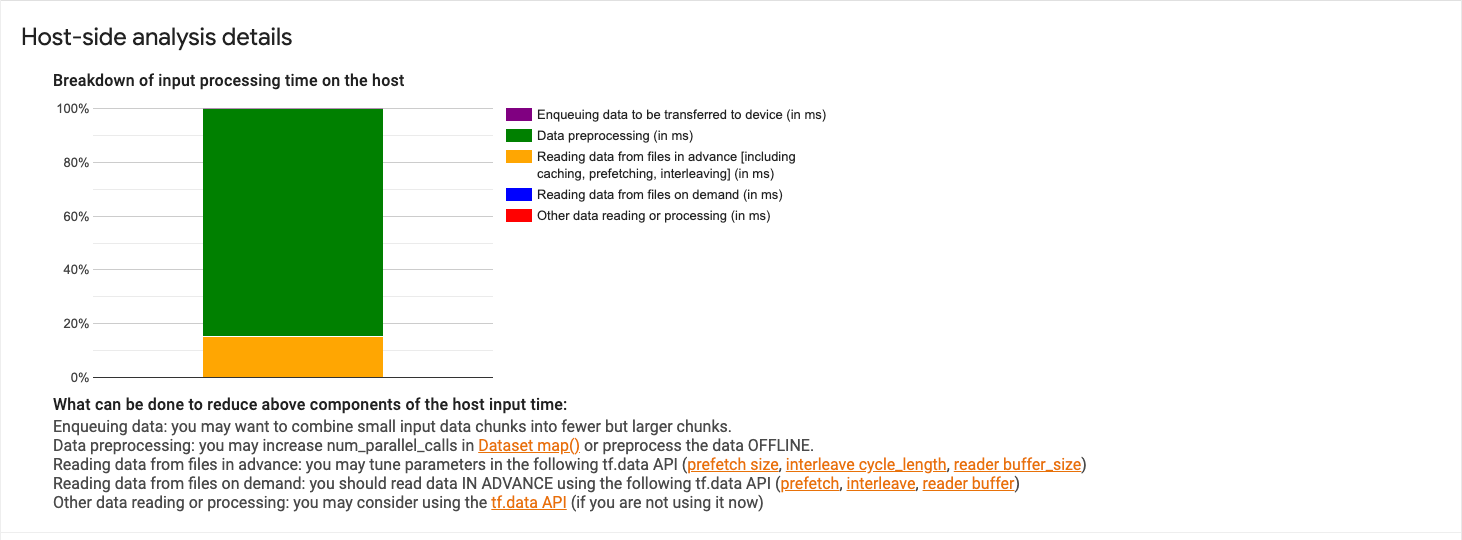
To see the statistics for individual input operations and their categories broken down by execution time, expand the Show Input Op statistics section.
A source data table like the following appears:
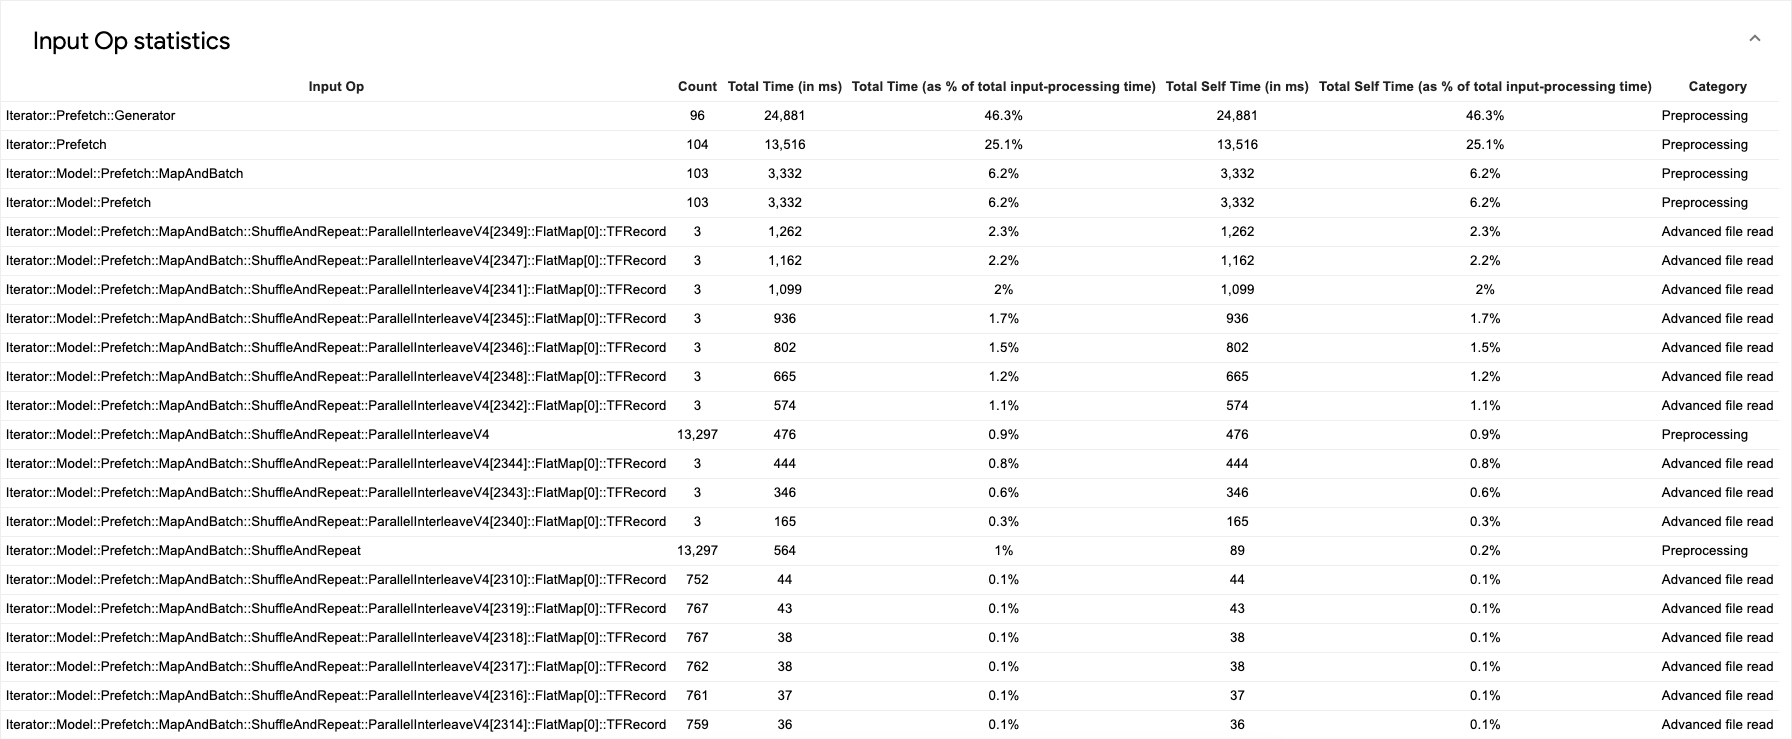
Each table entry contains the following information:
- Input Op: Shows the TensorFlow operation name of the input operation.
- Count: Shows the total number of instances of the operation executed during the profiling period.
- Total Time (in ms): Shows the cumulative sum of time spent on each of the operation instances.
- Total Time %: Shows the total time spent on an operation as a fraction of the total time spent in input processing.
- Total Self-time (in ms): Shows the accumulated time
over all instances of the function. The self-time measures the time spent
inside the function body, excluding the time spent in any functions it calls.
For example, the
Iterator::PaddedBatch::Filter::ForeverRepeat::Mapis called byIterator::PaddedBatch::Filter, therefore its total self-time is excluded from the total self-time of the latter. - Total self-time %: Shows the total self-time as a fraction of the total time spent on input processing.
- Category: Shows the processing category of the input operation.
Op profile
Op profile is a Cloud TPU tool that displays the performance statistics of XLA operations executed during a profiling period. The operation profile shows:
- How well your application uses the Cloud TPU as a percentage of time spent on operations by category and of TPU FLOPS utilization.
- The most time-consuming operations. Those operations are potential targets for optimization.
- Details of individual operations, including shape, padding and expressions that use the operation.
You can use op profile to find targets for optimization. For example, you can use operation profile to identify which XLA operations are taking the longest time to run and how many TPU FLOPS they consume.
Using op profile
The Op Profile tool contains performance statistics of XLA operations. You can view Op Profile data in TensorBoard by clicking on the Profile tab at the top of the screen and then selecting op_profile from the Tools drop-down. You will see a display like this:
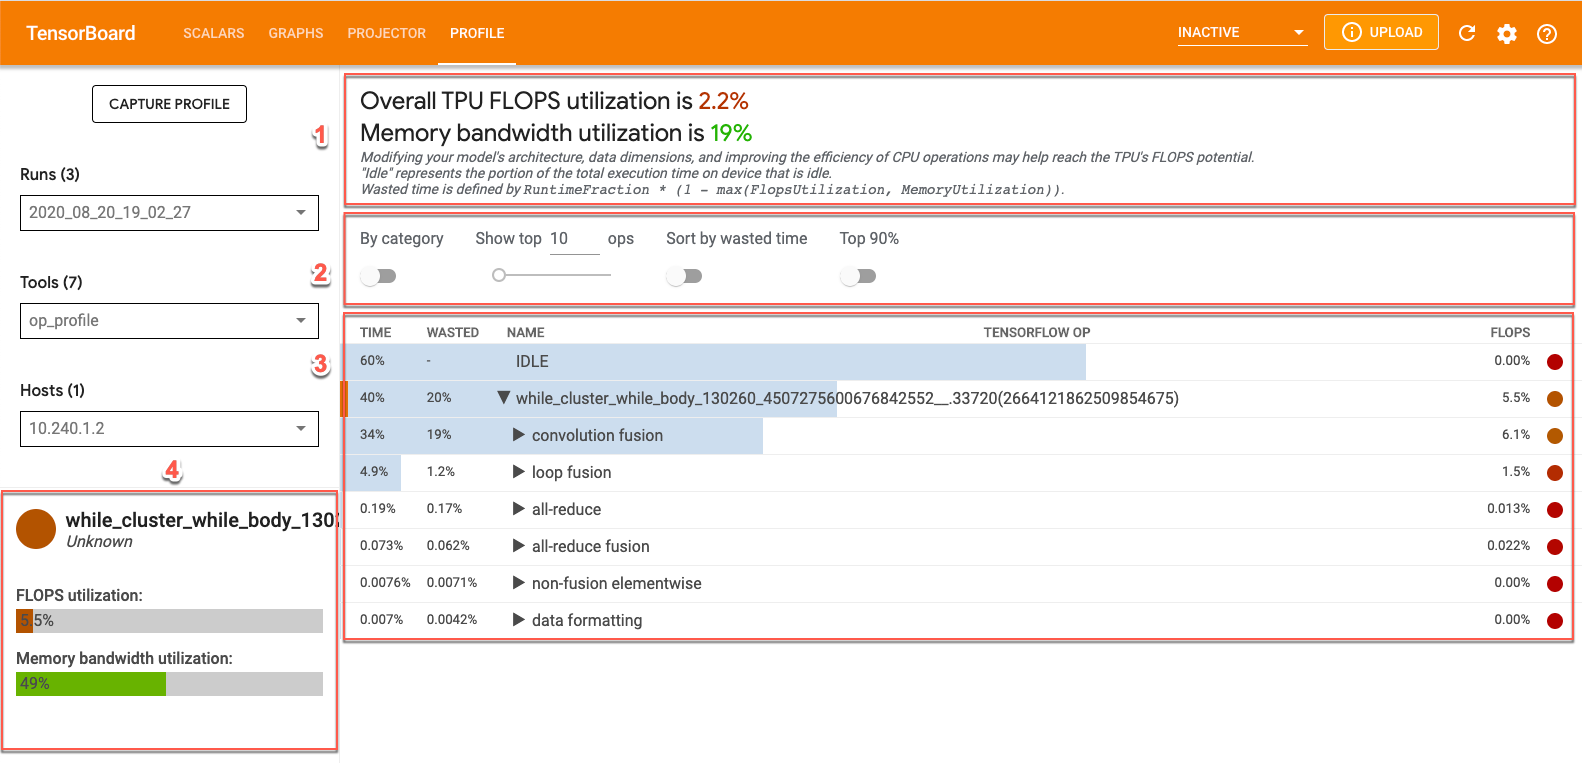
- Overview section: Shows Cloud TPU utilization and provides suggestions for optimization.
- Control panel: Contains controls that let you set the number of operations displayed in the table, which operations are displayed, and how they are sorted.
- Op table: Lists the top TensorFlow operation categories associated with the XLA ops. These operations are sorted by percentage of Cloud TPU usage.
- Op details cards: Displays details about the operations that appear when you point to an operation in the table. These details include the FLOPS utilization, the expression in which the operation is used, and the operation layout (fit).
XLA Op table
The operation table lists XLA operation categories in order from the highest to lowest percentage of Cloud TPU usage. The table shows the percentage of time taken, the operation category name, the associated TensorFlow op name, and the percentage of FLOPS utilization for the category. To display (or hide) the ten most time-consuming XLA operations for a category, click the triangle next to the category name in the table.
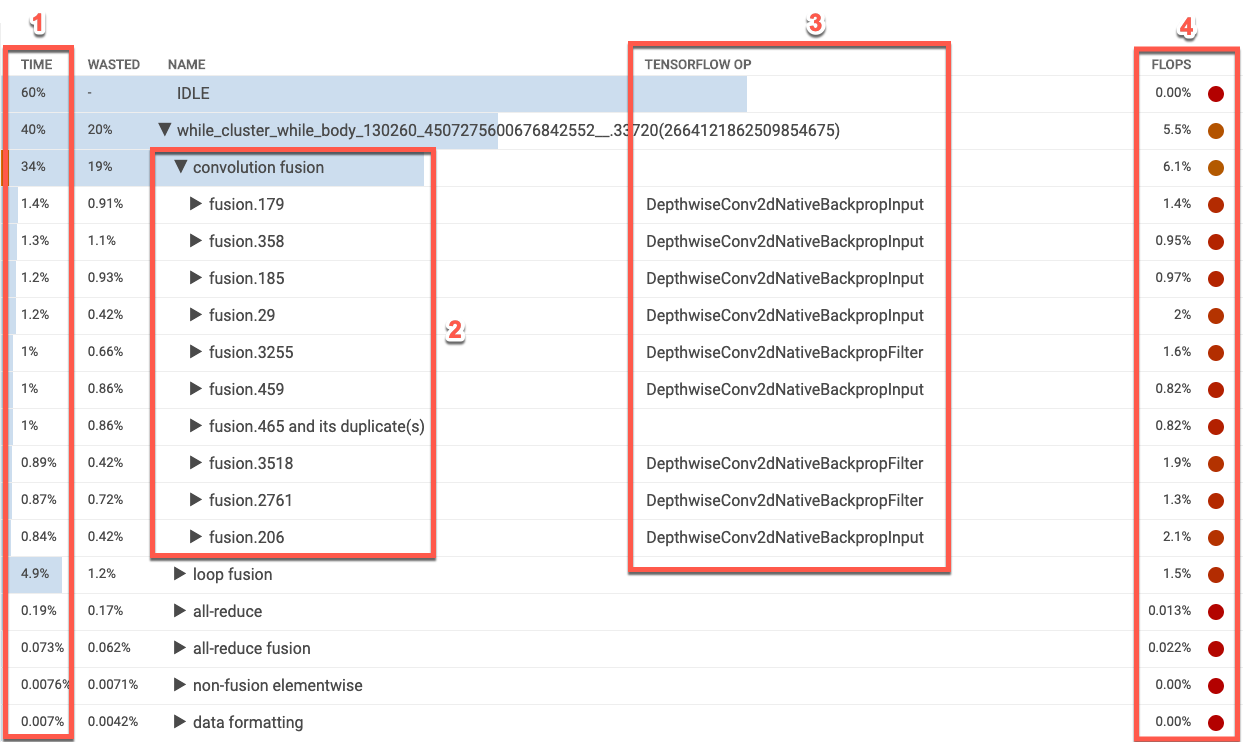
- Time: Shows the total percentage of time spent by all the operations in that category. You can click to expand the entry and see the breakdown of time spent by each individual operation.
- Top ten Ops: The toggle next to a category name that displays or hides the top ten time-consuming operations within the category. If a fusion operation entry is displayed in the operations list, you can expand it to see the non-fusion, element wise operations it contains.
- TensorFlow Op: Shows the TensorFlow operation name associated with the XLA operation.
- FLOPS: Shows the FLOPS utilization, which is the measured number of FLOPS expressed as a percentage of the Cloud TPU peak FLOPS. The higher the FLOPS utilization percentage, the faster operations run. The table cell is color coded: green for high FLOPS utilization (good) and red for low FLOPS utilization (bad).
Op details cards
When you select a table entry, a card appears displaying details about the XLA operation or the operation category. A typical card looks like this:
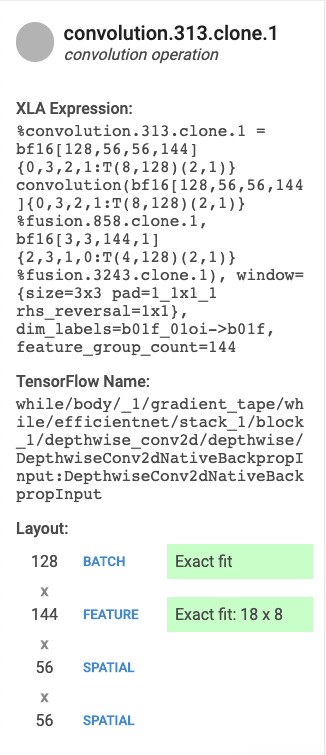
- Name and Category: Shows the highlighted XLA operation name and category.
- FLOPS utilization: Displays FLOPS utilization as a percentage of total FLOPS possible.
- Expression: Shows the XLA expression containing the operation.
- Memory Utilization: Displays the percentage of peak memory usage by your program.
- Layout: (Convolution operations only) Shows the shape and layout of a tensor, including a description of any padding performed by the XLA compiler.
Interpreting results
For convolution operations, low TPU FLOPS utilization may be due to one or both of the following reasons:
- padding (matrix units are partially used)
- convolution operation is memory bound
This section gives an interpretation of some performance metrics from a model with low FLOP utilization. In this example, output fusion and convolution dominated the execution time. There were many vector or scalar operations that had low FLOP utilization.
One optimization strategy for this type of profile is to transform the vector or scalar operations to convolution operations.
In the following example, %convolution.399 shows lower FLOPS and memory utilization than %convolution.340 in the previous example.
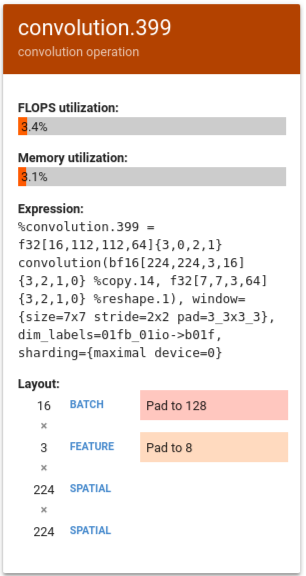
In this example, the batch size is being padded to 128 and feature size is being padded to 8. In this case, only 5% of the matrix units are being used effectively. Utilization is calculated by (((batch_time * num_of_features) / padding_size ) / num_of_cores). Compare the FLOPS in this example to the %convolution.340 in the previous example which uses no padding.
Trace viewer
Trace viewer is a Cloud TPU performance analysis tool available on the Profile page. The tool uses the Chrome trace event profiling viewer so it only works in the Chrome browser.
Trace viewer displays a timeline that shows:
- Durations for the operations that were executed by your TensorFlow model.
- Which part of the system (TPU or host machine) executed an operation. Typically, the host machine executes infeed operations, which preprocess training data and transfers it to the TPU, whereas the TPU executes the actual model training.
Trace viewer lets you identify performance problems in your model, then take steps to resolve them. For example, at a high level, you can identify whether infeed or model training is taking most of the time. Drilling down, you can identify which TensorFlow operations are taking the longest to execute.
Trace viewer is limited to 1M events for each Cloud TPU. If you need to assess more events, use the streaming trace viewer instead.
Trace viewer interface
To open trace viewer, go to TensorBoard, click the Profile tab at the top of the screen, and choose trace_viewer from the Tools drop-down. The viewer appears displaying your most recent run:
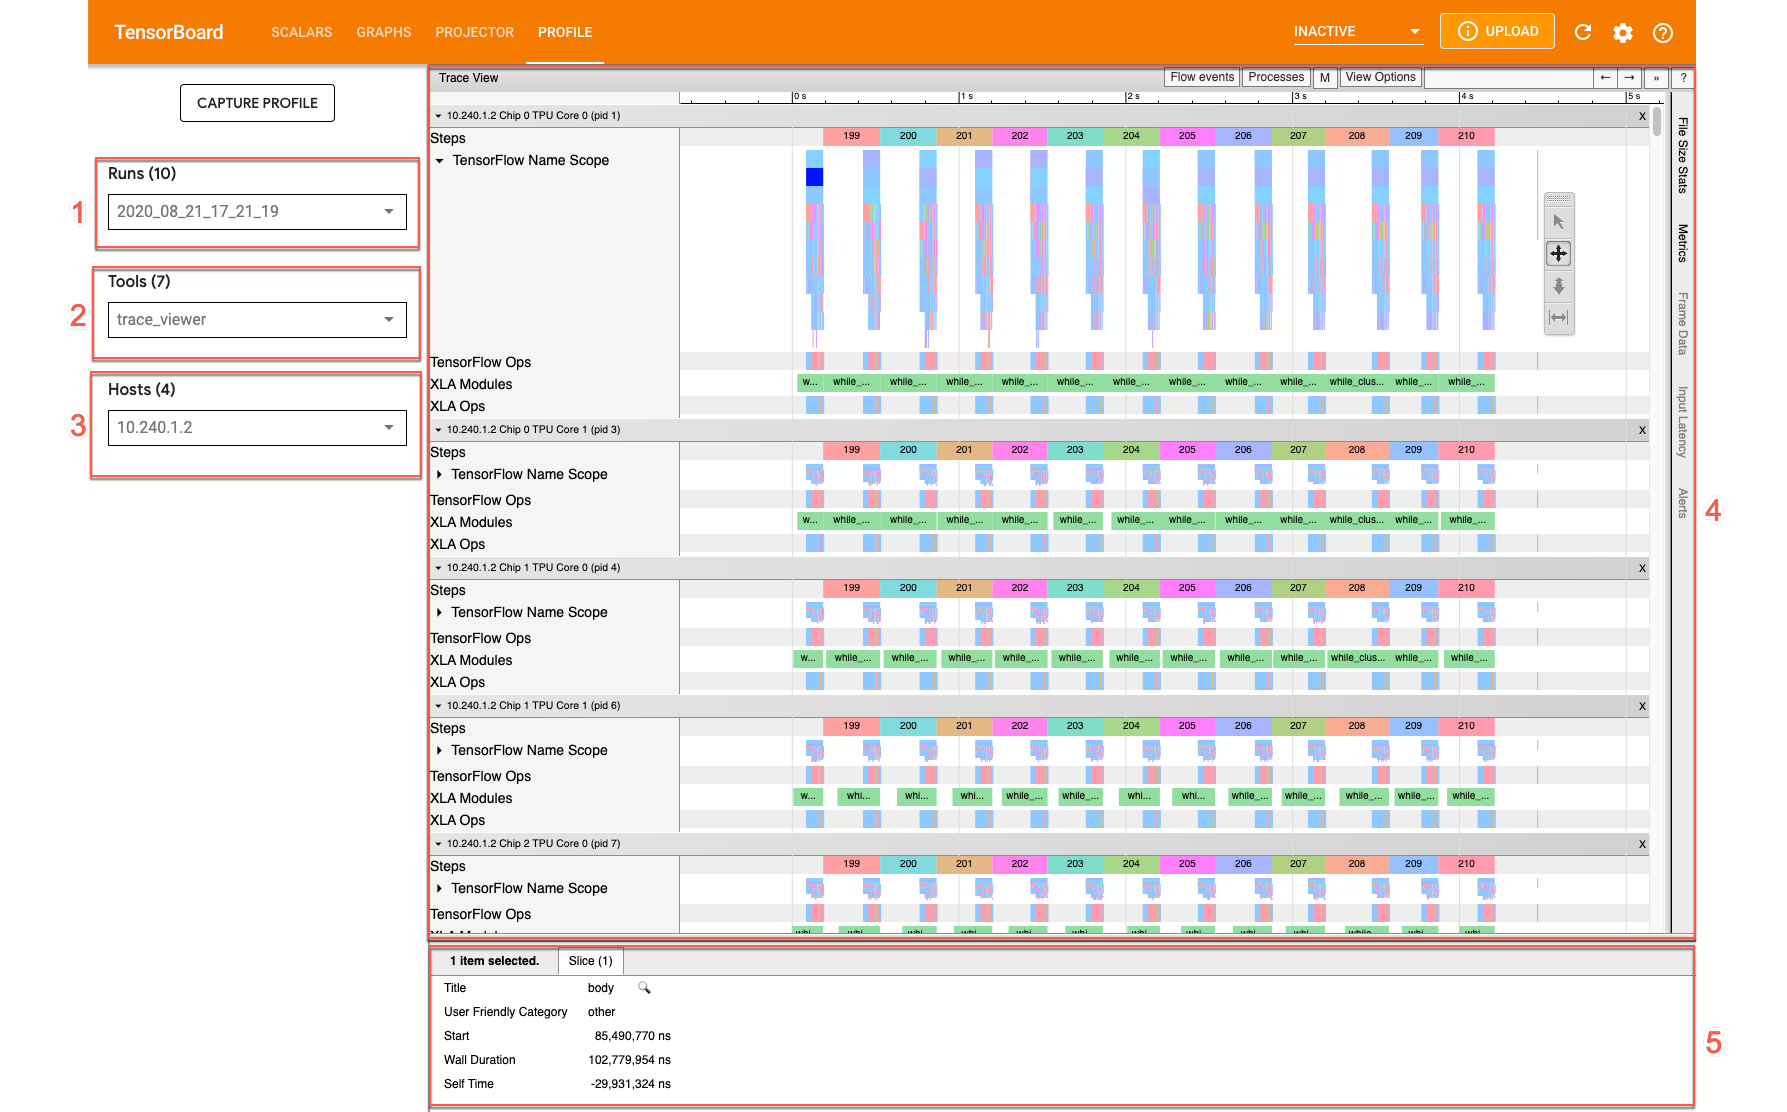
This screen contains the following main elements (marked with numbers in the preceding screen shot):
- Runs drop-down: Contains all runs for which you've captured trace information. The default view is your most recent run, but you can open the drop-down to select a different run.
- Tools drop-down: Selects different profiling tools.
- Host drop-down: Selects a host that contains a Cloud TPU set.
- Timeline pane: Shows operations that Cloud TPU and the host machine executed over time.
- Details pane: Shows additional information for operations selected in the Timeline pane.
Here's a closer look at the timeline pane:
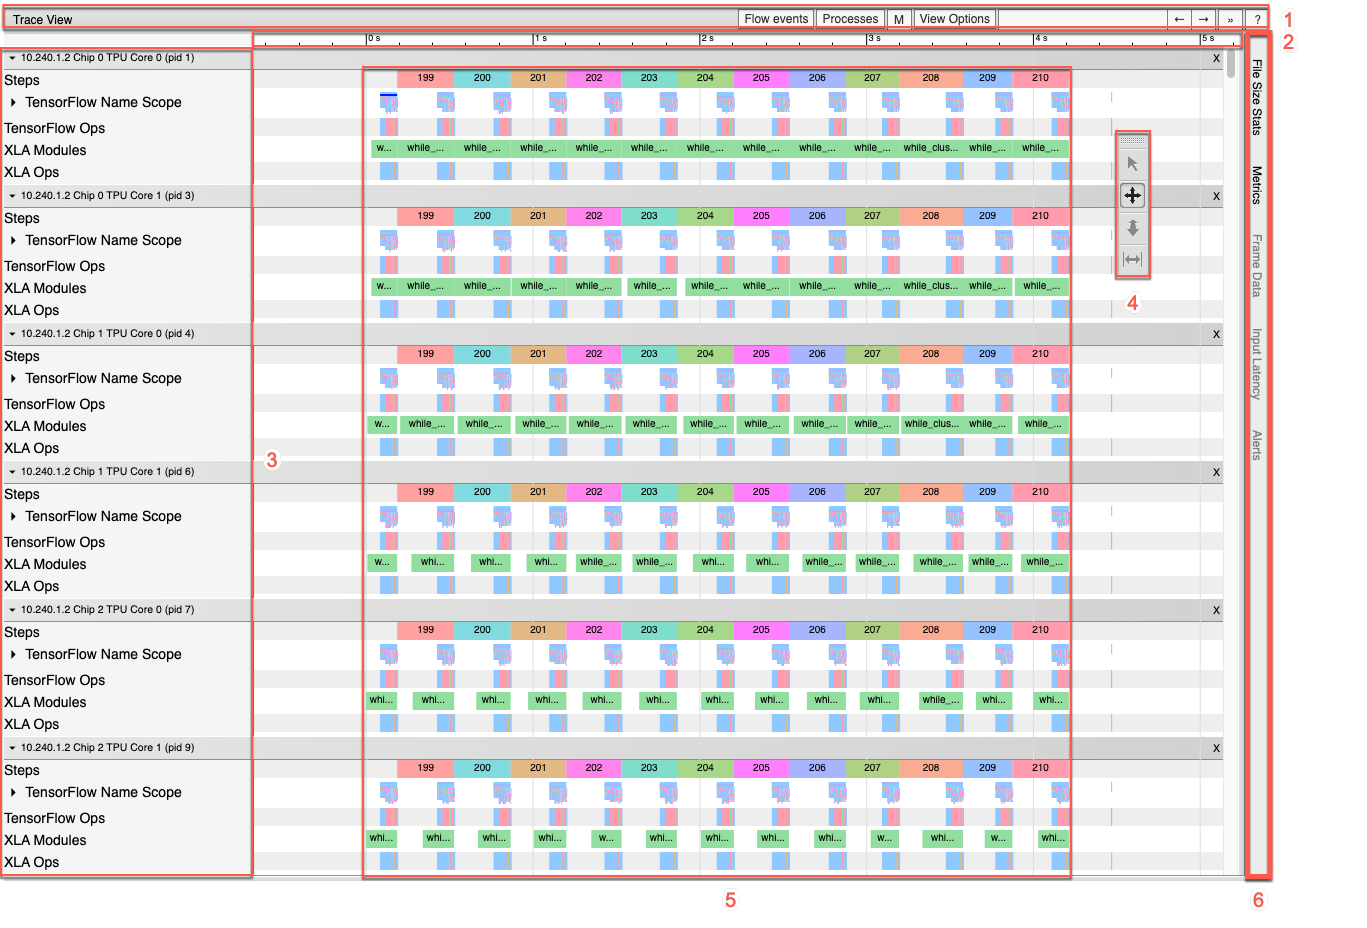
The Timeline pane contains the following elements:
- Top bar: Contains various auxiliary controls.
- Time axis: Shows time relative to the beginning of the trace.
- Section and track labels: Each section contains multiple tracks and has a triangle on the left that you can click to expand and collapse the section. There is one section for every processing element in the system.
- Tool selector: Contains various tools for interacting with the trace viewer.
- Events: Shows the time during which an operation was executed or the duration of meta-events, such as training steps.
- Vertical tab bar: This bar does not have a useful purpose for Cloud TPU. The bar is part of the general purpose trace viewer tool provided by Chrome that is used for a various performance analysis tasks.
Sections and tracks
Trace viewer contains the following sections:
- One section for each TPU node, labeled with the number of the TPU chip
and the TPU core within the chip (for example, "Chip 2: TPU Core 1"). Each
TPU node section contains the following tracks:
- Step: Shows the duration of the training steps that were running on the TPU.
- TensorFlow Ops: Shows TensorFlow operations executed on the TPU.
- XLA Ops: Shows XLA operations that ran on the TPU. (Each operation is translated into one or several XLA operations. The XLA compiler translates the XLA operations into code that runs on the TPU.)
- One section for threads running on the host CPU, labeled "Host Threads". The section contains one track for each CPU thread. Note: You can ignore the information displayed alongside the section labels.
Timeline tool selector
You can interact with the timeline view using the timeline tool selector in TensorBoard. Click a timeline tool to activate and highlight a tool. To move the timeline tool selector, click in the dotted area at the top and then drag the selector to where you want it.
Use the timeline tools as follows:
|
Selection tool Click an event to select it or drag to select multiple events. Additional information about the selected event or events (name, start time, and duration) will be displayed in the details pane. |
|
Pan tool Drag to pan the timeline view horizontally and vertically. |
|
Zoom tool Drag up to zoom in or drag down to zoom out along the horizontal (time) axis. The horizontal position of the mouse cursor determines the center around which the zoom takes place. Note: If the zoom tool remains active after you release the mouse button, click the timeline view to deactivate the zoom tool. |
|
Timing tool Drag horizontally to mark a time interval. The length of the interval appears on the time axis. To adjust the interval, drag its ends. To clear the interval, click anywhere inside the timeline view. If you select another tool, the interval remains marked. |
Memory viewer
Memory viewer lets you visualize the peak memory usage and memory usage trends for your program.
The memory viewer user interface looks like this:
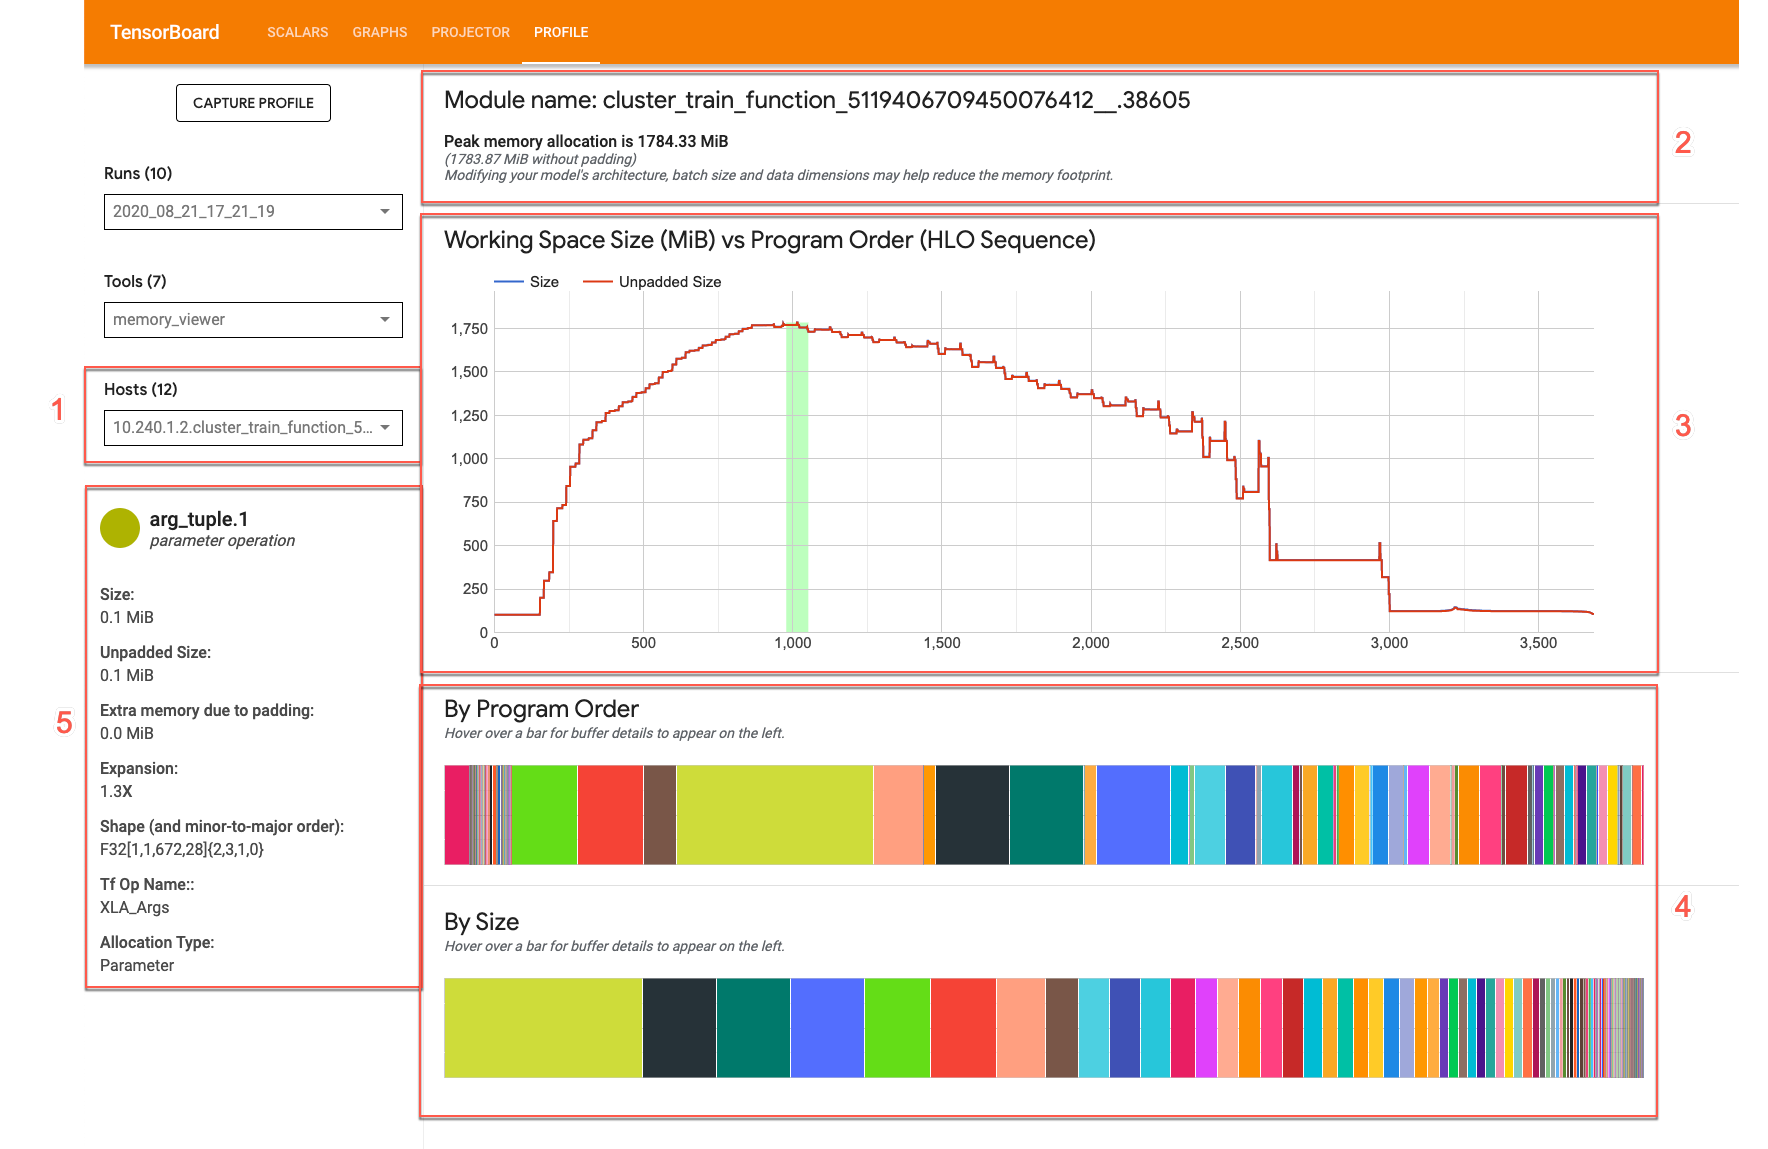
- Host drop-down: Selects a TPU host and XLA High Level Optimizer (HLO) modules to visualize.
- Memory overview: Displays peak memory allocation and size without padding.
- Working space chart: Displays peak memory use and a plot of memory usage trends for your program. Point to a buffer in one of the buffer charts to display additional information in the buffer allocation card.
- Buffer charts: Two charts that display buffer allocation at peak memory usage. Point to a buffer in one of the buffer charts to display additional information in the buffer details card.
- Buffer allocation details card: Displays allocation details for a buffer.
Memory overview panel
The memory overview (top) panel shows you the module name and the peak memory allocation set when the total buffer allocation size reaches the maximum. The unpadded peak allocation size is also shown for comparison.

Working space chart
This chart displays peak memory use and a plot of memory usage trends for your program. The vertical line indicates peak memory utilization for the program. This charts shows if your program can fit into the available global memory space.
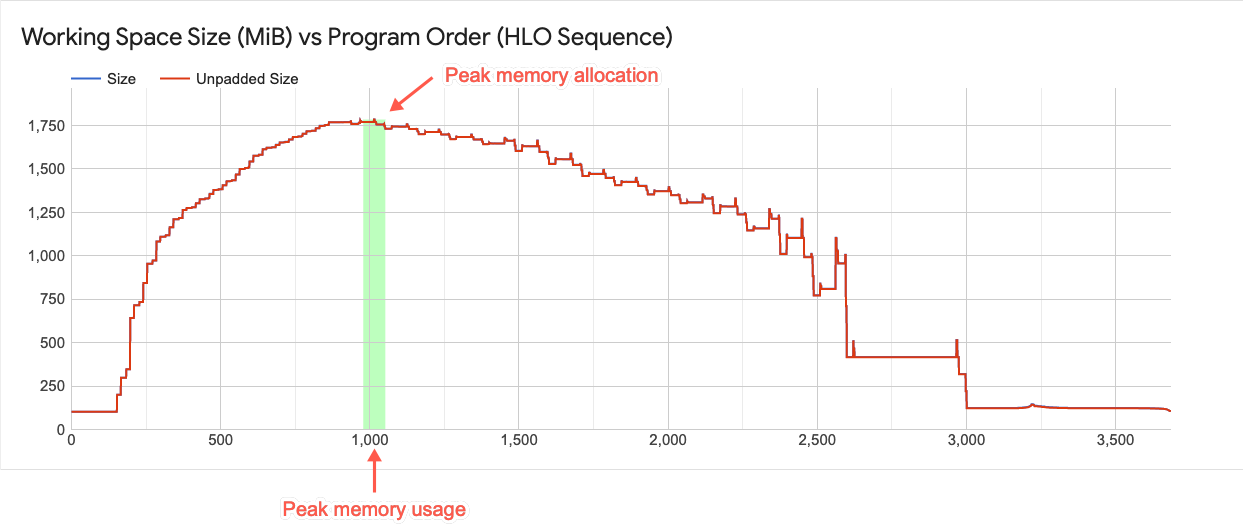
Each point in the graph represents a "program point" in the XLA HLO program. The line shows you how memory usage of your program changes over time.
Interaction with buffer chart elements
When you point to a buffer in a buffer chart, a horizontal line showing the lifetime of the buffer appears in the working space chart.
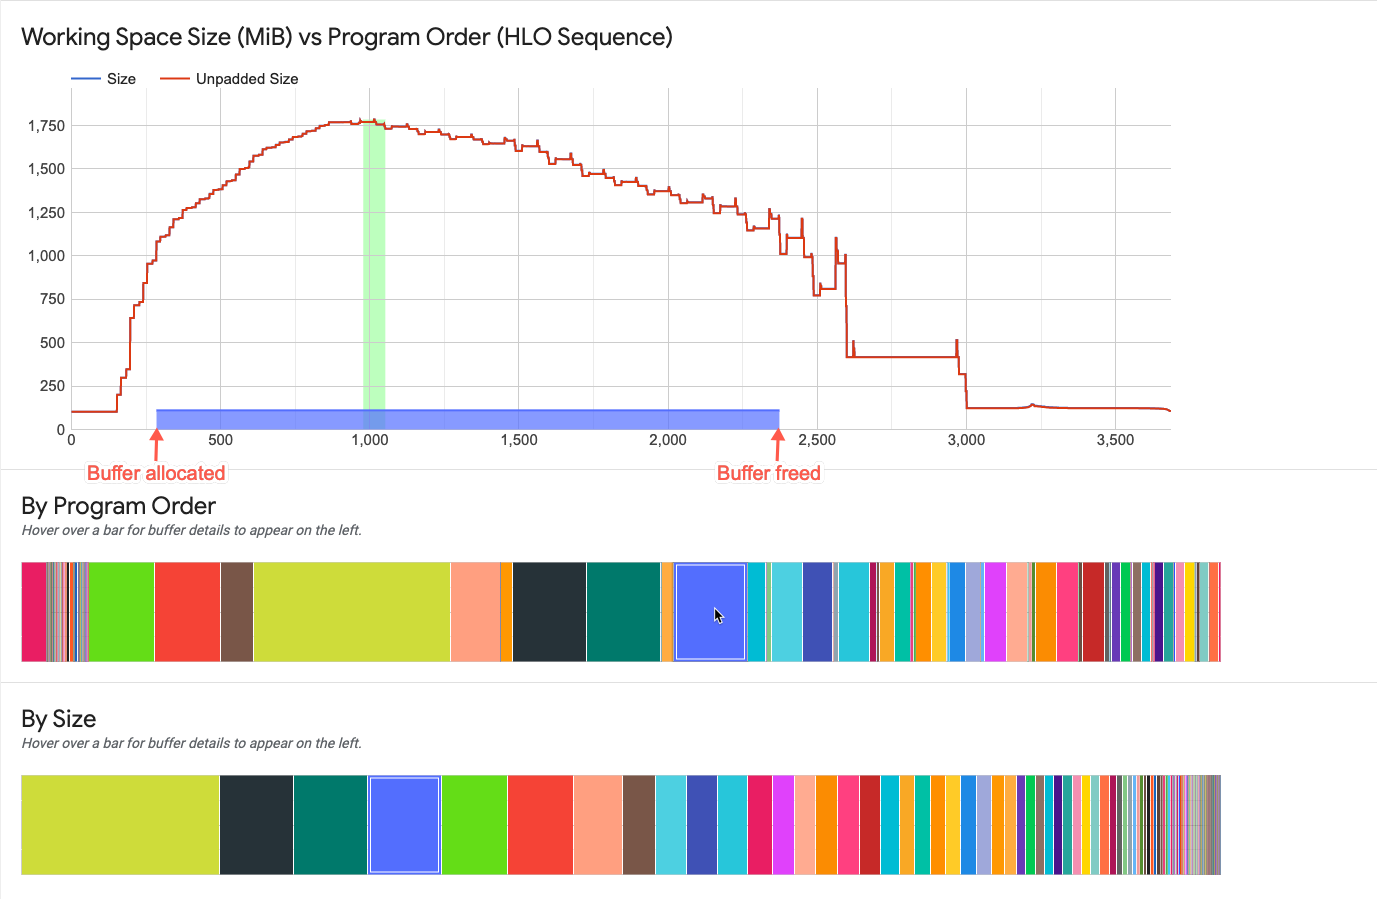
The thickness of the horizontal line indicates the relative magnitude of the buffer size relative to the peak memory allocation. The length of the line indicates the lifetime of the buffer.
Buffer charts
Two charts show the breakdown of memory usage at the peak usage.
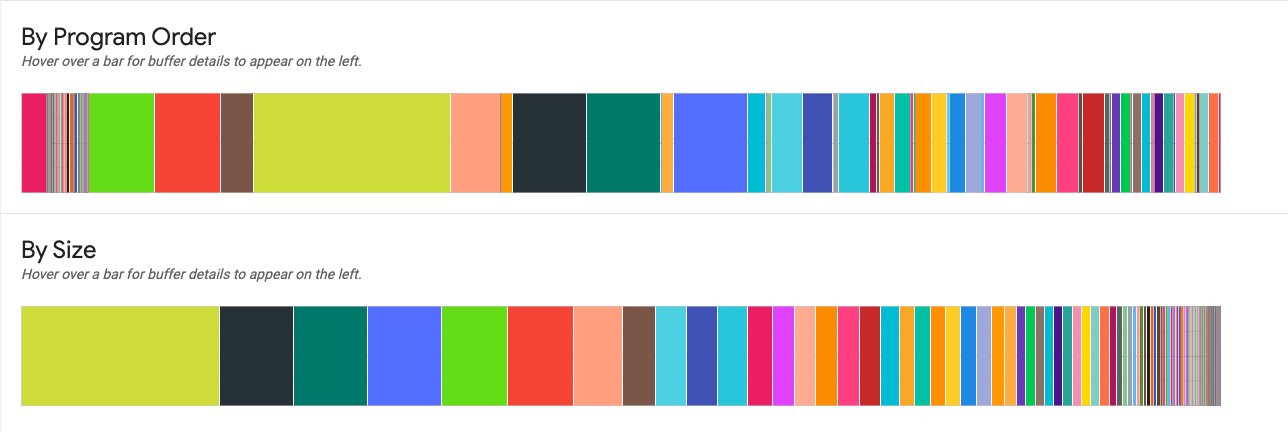
By Program Order: Displays the buffers from left to right in the order in which they were active during program execution.
By Size: Displays the buffers that were active during program execution in order of decreasing size.
Buffer allocation details card
When you point to a buffer displayed in one of the buffer charts, a buffer allocation details card appears. A typical details card looks like this:
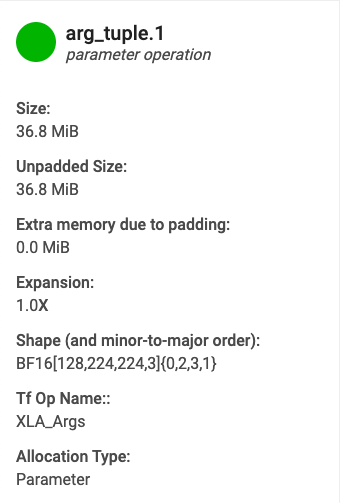
- Name: Name of the XLA operation.
- Category: The operation category.
- Size: The size of the buffer allocation (including padding).
- Unpadded size: The size of the buffer allocation without padding.
- Expansion: The relative magnitude of padded buffer size versus the unpadded size.
- Extra memory: Indicates how much extra memory is used for padding.
- Shape: Describes the rank, size, and data type of the N-dimensional array.
- TensorFlow op name: Shows the name of the TensorFlow operation associated with the buffer allocation.
- Allocation type: Indicates buffer allocation category: Parameter, Output, Thread-local, and Temporary (for example, buffer allocation within a fusion).
Out of memory errors
If you run a model and get an "out of memory" error, use the guidelines in this document to capture a profile. Wait until your script is training your model before starting the profiler. The profiling output can help you understand what caused the error.


