Profile PyTorch XLA workloads
Profiling is a way to analyze and improve the performance of models. Although there is much more to it, sometimes it helps to think of profiling as timing operations and parts of the code that run on both devices (TPUs) and hosts (CPUs). This guide provides a quick overview of how to profile your code for training or inference. For more information on how to analyze generated profiles, please refer to the following guides.
- PyTorch XLA performance debugging on TPU VMs - part 1
- PyTorch XLA performance debugging on TPU VMs - part 2
- PyTorch XLA performance debugging on TPU VMs - part 3
Get Started
Create a TPU
Export environment variables:
$ export TPU_NAME=your_tpu_name
$ export ZONE=us-central2-b
$ export PROJECT_ID=project-id
$ export ACCELERATOR_TYPE=v4-8
$ export RUNTIME_VERSION=tpu-vm-v4-pt-2.0
Export variable descriptions
TPU name- The name you want to use for your Cloud TPU.
zone- The zone where you plan to create your Cloud TPU.
project ID- The project ID you are using to train and profile your model.
accelerator-type- The accelerator type specifies the version and size of the Cloud TPU you want to create. For more information about supported accelerator types for each TPU version, see TPU versions.
version- The Cloud TPU runtime version. A default is shown in the exported variable, but you can also use one from the list of supported configurations.
Launch the TPU resources
$ gcloud compute tpus tpu-vm create ${TPU_NAME} \
--zone us-central2-b \
--accelerator-type ${ACCELERATOR_TYPE} \
--version ${RUNTIME_VERSION} \
--project $PROJECT_ID \
--subnetwork=tpusubnet
Move your code to your home directory on the TPU VM using the
gcloud scpcommand. For example:$ gcloud compute tpus tpu-vm scp my-code-file ${TPU_NAME}: --zone ${ZONE}
Profiling
A profile can be captured manually through capture_profile.py or
programmatically from within the training script using the
torch_xla.debug.profiler APIs.
Starting the Profile Server
In order to capture a profile, a profile server must be running within the
training script. Start a server with a port number of your choice, for example
9012 as shown in the following command.
import torch_xla.debug.profiler as xp
server = xp.start_server(9012)
The server can be started right at the beginning of your main function.
You can now capture profiles as described in the following section. The script profiles everything that happens on one TPU device.
Adding Traces
If you would also like
to profile operations on the host machine, you can add xp.StepTrace or
xp.Trace in your code. These functions trace the Python code on the
host machine.
(You can think of this as measuring how much time it takes to execute the Python
code on the host (CPU) before passing the "graph" to the TPU device. So it is mostly useful for analysing tracing overhead). You can
add this inside the training loop where the code processes batches of data,
for example,
for step, batch in enumerate(train_dataloader):
    with xp.StepTrace('Training_step', step_num=step):
       ...
or wrap individual parts of the code with
 with xp.Trace('loss'):
    loss = ...
If you are using Lighting you can skip adding traces as it is done automatically in some parts of the code. However if you want to add additional traces, you are welcome to insert them inside the training loop.
You will be able to capture device activity after the initial compilation; wait until the model starts its training or inference steps.
Manual Capture
The capture_profile.py script from the Pytorch XLA repository
enables quickly capturing a profile. You can do this by copying the
capture profile file
directly to your TPU VM. The following command copies it to the home directory.
$ gcloud compute tpus tpu-vm ssh ${TPU_NAME} \
--zone us-central2-b \
--worker=all \
--command="wget https://raw.githubusercontent.com/pytorch/xla/master/scripts/capture_profile.py"
While training is running, execute the following to capture a profile:
$ gcloud compute tpus tpu-vm ssh ${TPU_NAME} \
--zone us-central2-b \
--worker=all \
--command="python3 capture_profile.py --service_addr "localhost:9012" --logdir ~/profiles/ --duration_ms 2000"
This command saves .xplane.pb files in the logdir. You can change
the logging directory
~/profiles/ to your preferred location and name. It is also possible to
directly save in the Cloud Storage bucket. To do that, set
logdir to be gs://your_bucket_name/.
Programmatic Capture
Rather than capturing the profile manually by triggering a script, you can configure your training script to automatically trigger a profile by using the torch_xla.debug.profiler.trace_detached API within your train script.
As an example, to automatically capture a profile at a specific epoch and step,
you can configure your training script to consume PROFILE_STEP,
PROFILE_EPOCH, and PROFILE_LOGDIR environment
variables:
import os
import torch_xla.debug.profiler as xp

# Within the training script, read the step and epoch to profile from the
# environment.
profile_step = int(os.environ.get('PROFILE_STEP', -1))
profile_epoch = int(os.environ.get('PROFILE_EPOCH', -1))
...

for epoch in range(num_epoch):
   ...
   for step, data in enumerate(epoch_dataloader):
      if epoch == profile_epoch and step == profile_step:
         profile_logdir = os.environ['PROFILE_LOGDIR']
         # Use trace_detached to capture the profile from a background thread
         xp.trace_detached('localhost:9012', profile_logdir)
      ...
This will save the .xplane.pb files in the directory specified by the
PROFILE_LOGDIR environment variable.
Analysis in TensorBoard
To further analyze profiles you can use TensorBoard
with the TPU TensorBoard plug-in
either on the same or on another machine (recommended).
To run TensorBoard on a remote machine, connect to it using SSH and enable port forwarding. For example,
$ ssh -L 6006:localhost:6006 remote server address
or
$ gcloud compute tpus tpu-vm ssh $TPU_NAME --zone=$ZONE --ssh-flag="-4 -L 6006:localhost:6006"
On your remote machine, install the required packages and launch TensorBoard
(assuming you have profiles on that machine under ~/profiles/). If you stored
the profiles in another directory or Cloud Storage bucket, make sure to
specify paths correctly, for example, gs://your_bucket_name/profiles.
(vm)$ pip install tensorflow-cpu tensorboard-plugin-profile
(vm)$ tensorboard --logdir ~/profiles/ --port 6006
(vm)$ pip uninstall tensorflow tf-nightly tensorboard tb-nightly tbp-nightly
Running TensorBoard
In your local browser go to:
http://localhost:6006/
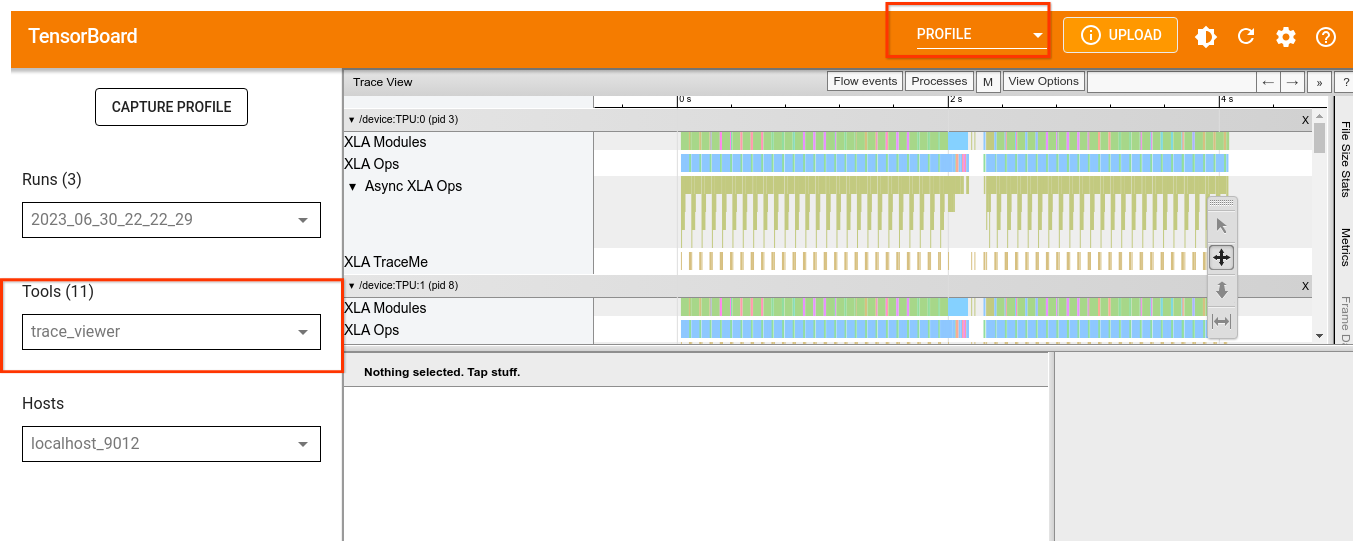
and choose PROFILE from the drop-down menu to load your profiles.
Refer to TPU tools for information on the TensorBoard tools and how to interpret the output.


