This page describes how to view and interpret your model evaluation results after running your model evaluation.
View evaluation results
After you define your evaluation task, run the task to get evaluation results, as follows:
eval_result: EvalResult = eval_task.evaluate(
  model=MODEL,
)
The EvalResult class represents the result of an evaluation run with the following attributes:
metrics_table: the per-instance results.summary_metrics: the aggregate results for all instances for all requested metrics.metadata: the experiment name and experiment run name for the evaluation run.
The EvalResult class is defined as follows:
@dataclasses.dataclass
class EvalResult:
    """Evaluation result.

    Attributes:
      summary_metrics: The summary evaluation metrics for an evaluation run.
      metrics_table: A table containing eval inputs, ground truth, and metric
        results per row.
      metadata: The metadata for the evaluation run.
    """

    summary_metrics: Dict[str, float]
    metrics_table: Optional["pd.DataFrame"] = None
    metadata: Optional[Dict[str, str]] = None
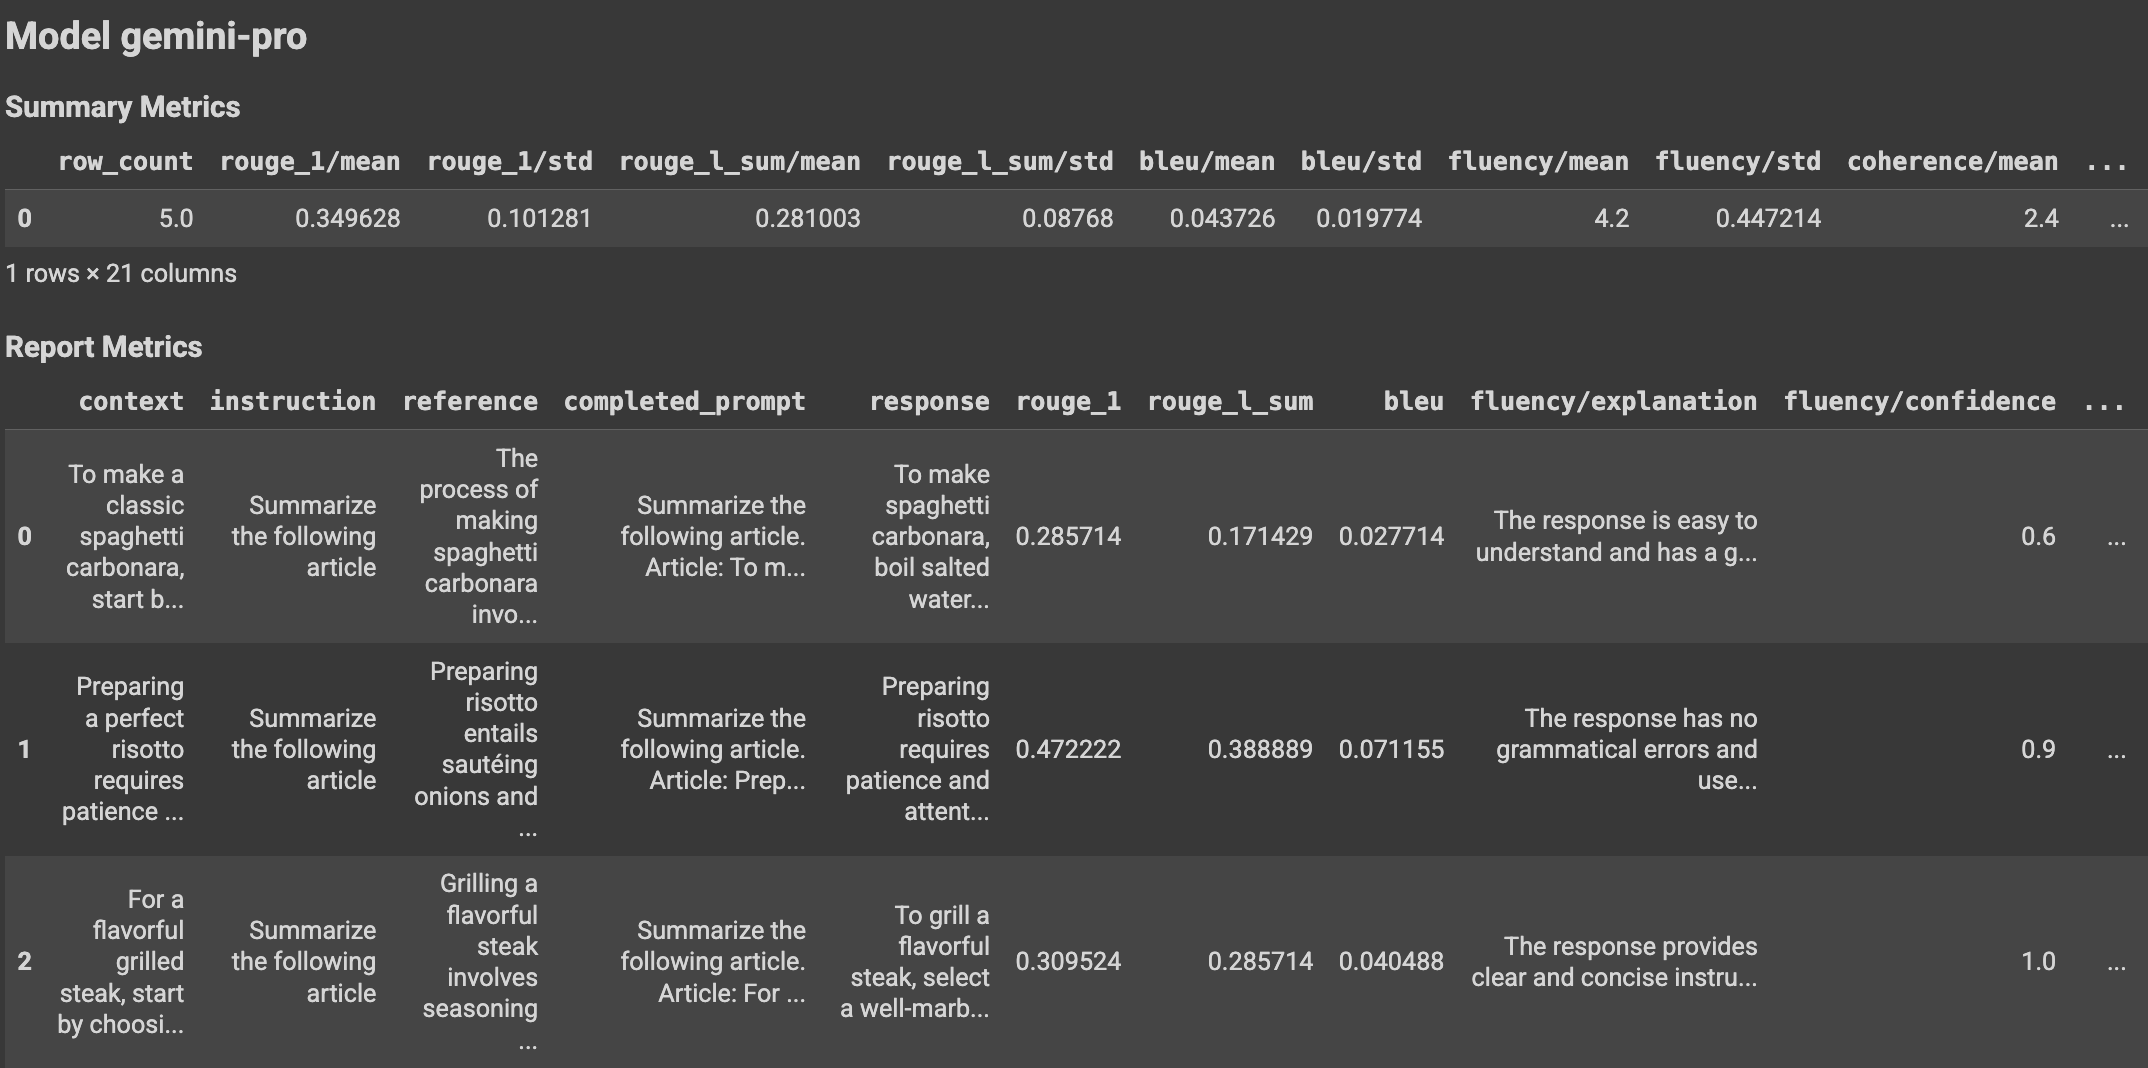
With the use of helper functions, the evaluation results can be displayed in the Colab notebook as follows:
Visualize evaluation results
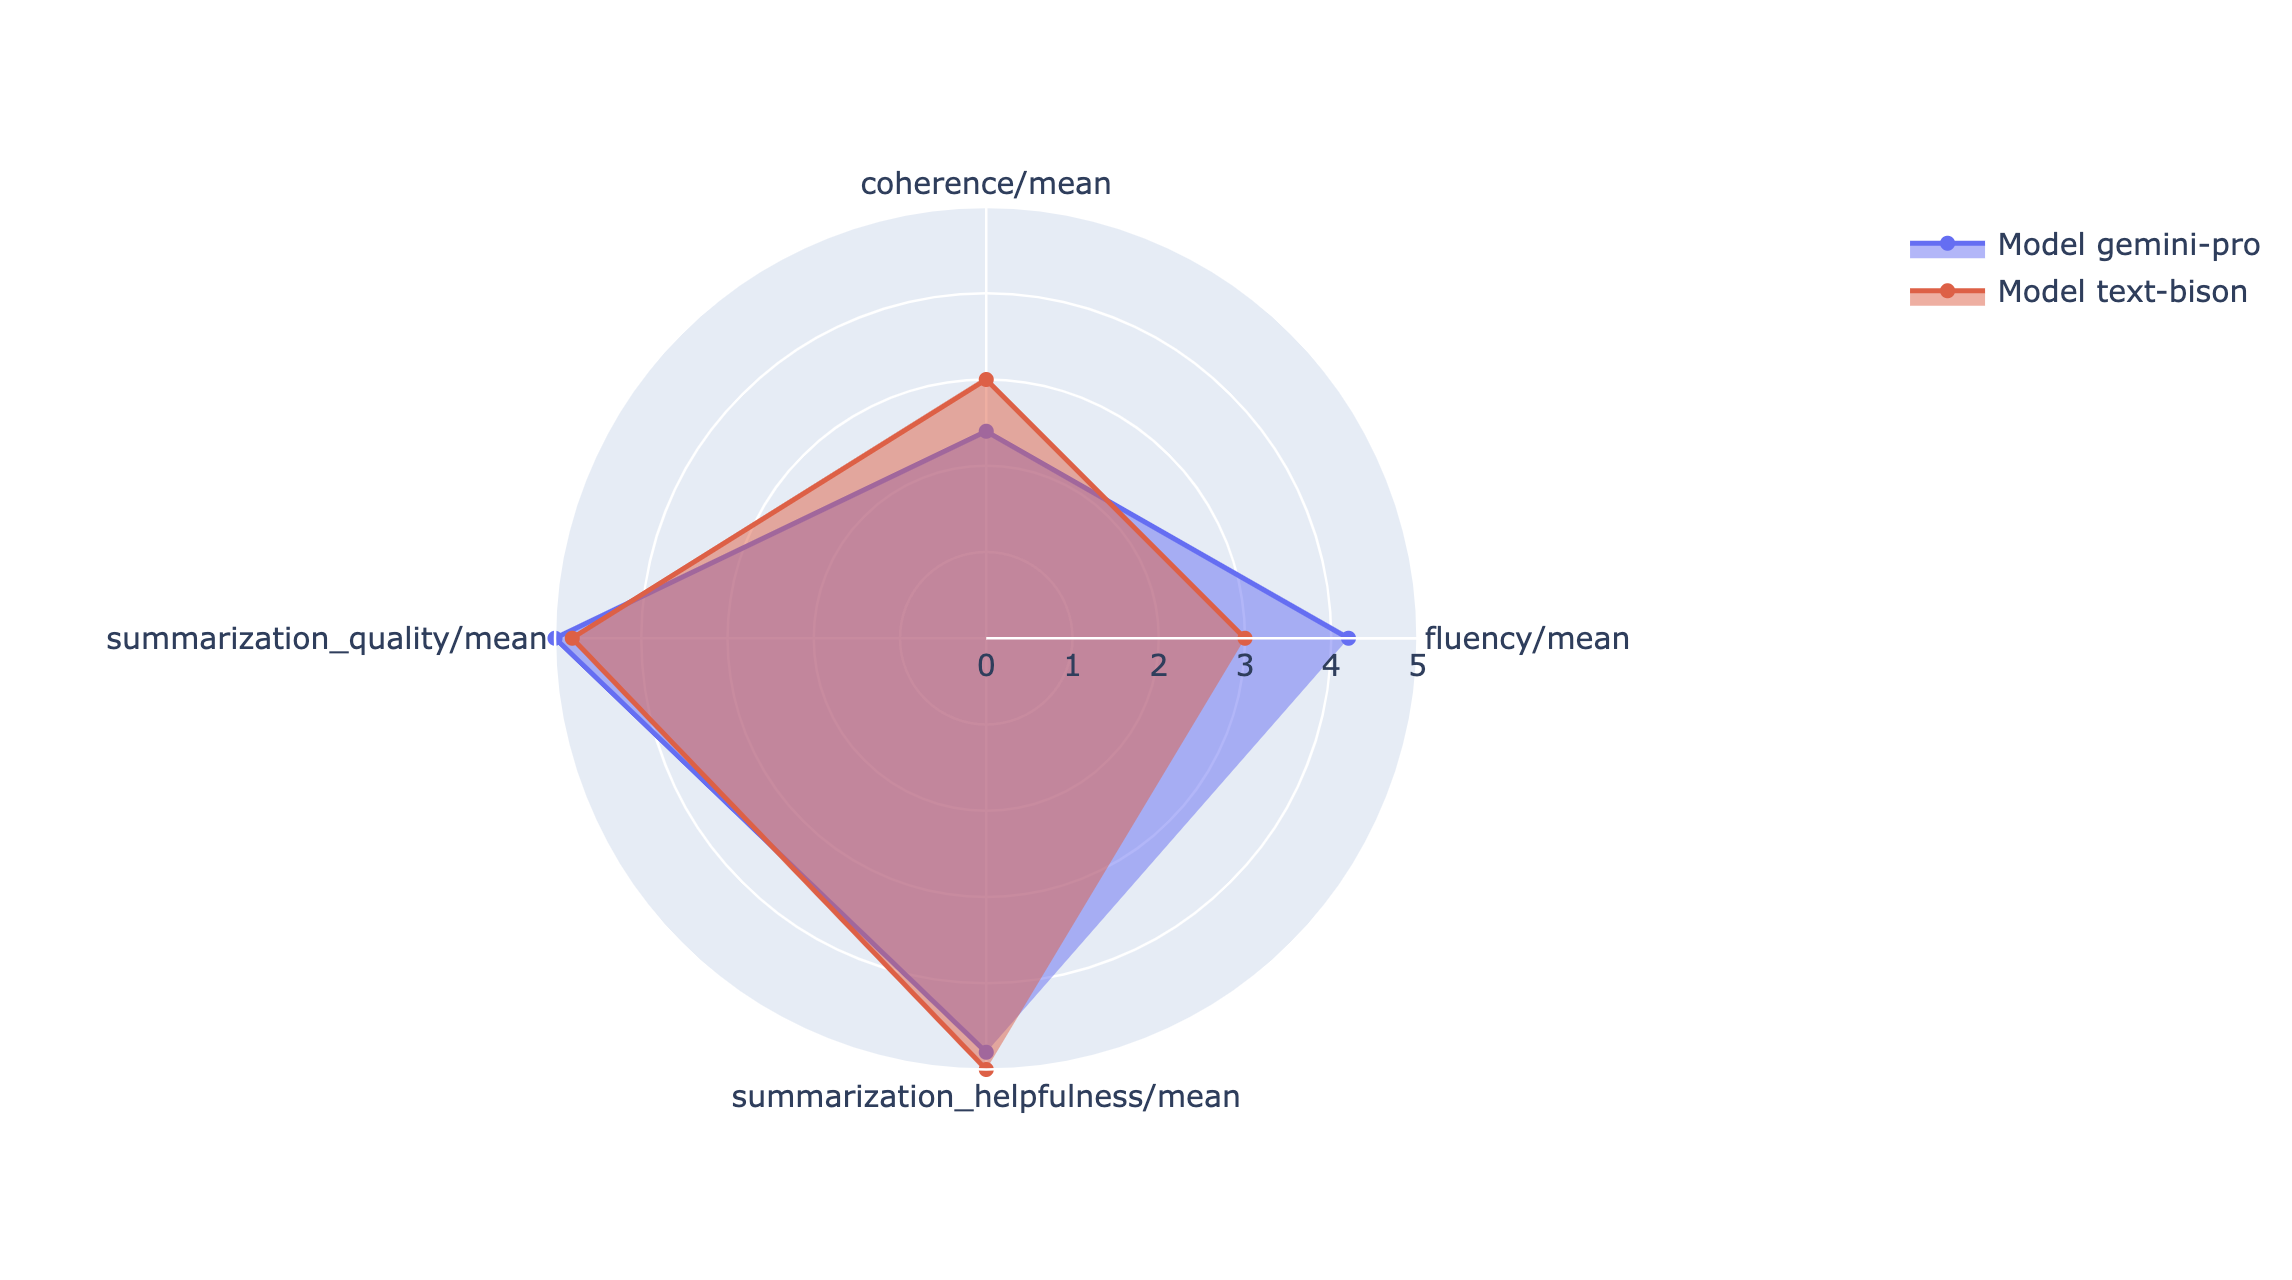
You can plot summary metrics in a radar or bar chart for visualization and comparison between results from different evaluation runs. This visualization can be helpful for evaluating different models and different prompt templates.
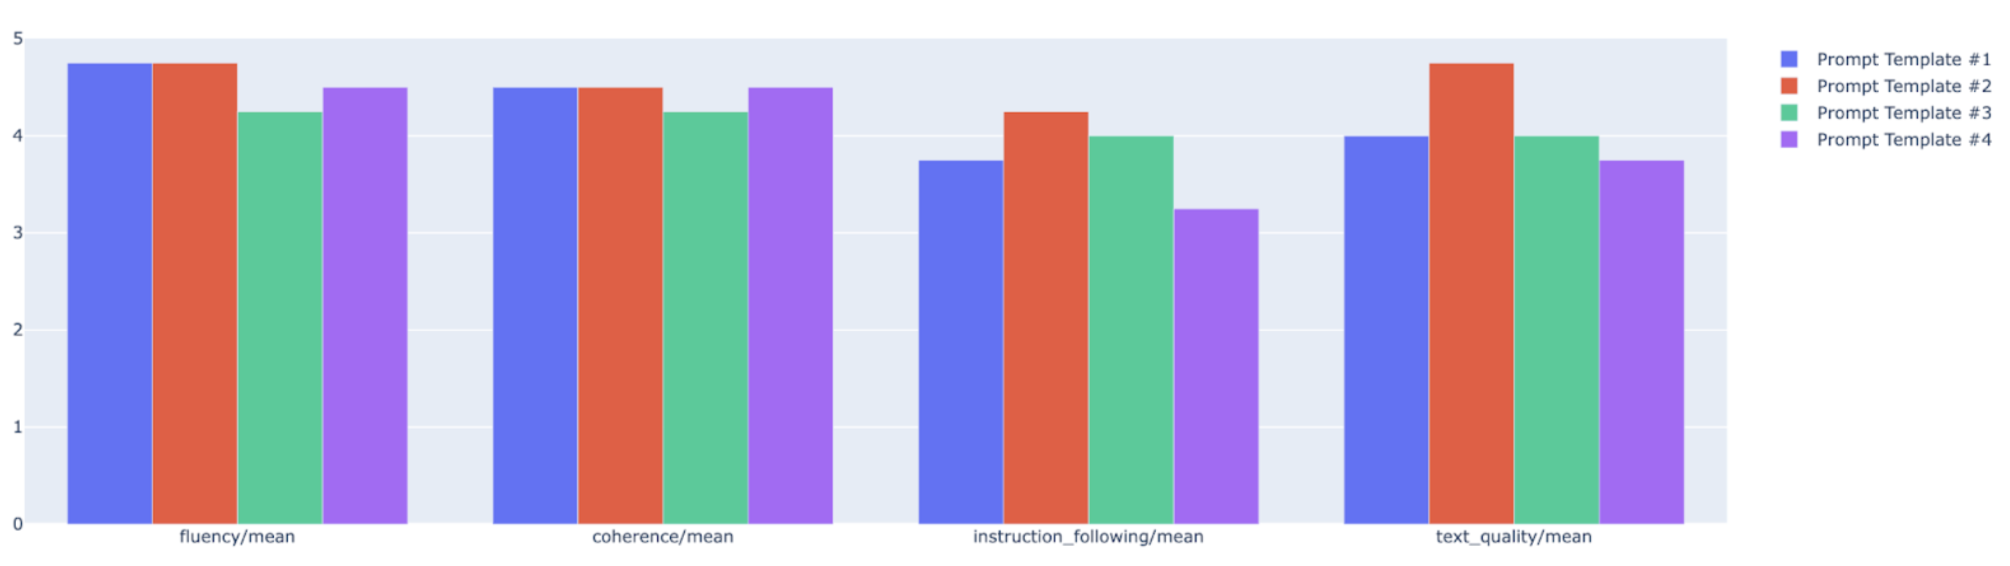
In the following example, we visualize four metrics (coherence, fluency, instruction following and overall text quality) for responses generated using four different prompt templates. From the radar and bar plot, we can infer that prompt template #2 consistently outperforms the other templates across all four metrics. This is particularly evident in its significantly higher scores for instruction following and text quality. Based on this analysis, prompt template #2 appears to be the most effective choice among the four options.
Understand metric results
The following tables list various components of instance-level and aggregate results included in metrics_table and summary_metrics respectively for PointwiseMetric, PairwiseMetric and computation-based metrics:
PointwiseMetric
Instance-level results
| Column | Description |
|---|---|
| response | The response generated for the prompt by the model. |
| score | The rating given to the response as per the criteria and rating rubric. The score can be binary (0 and 1), Likert scale (1 to 5, or -2 to 2), or float (0.0 to 1.0). |
| explanation | The judge model's reason for the score. We use chain-of-thought reasoning to guide the judge model to explain its rationale behind each verdict. Forcing the judge model to reason is shown to improve evaluation accuracy. |
Aggregate results
| Column | Description |
|---|---|
| mean score | Average score for all instances. |
| standard deviation | Standard deviation for all the scores. |
PairwiseMetric
Instance-level results
| Column | Description |
|---|---|
| response | The response generated for the prompt by candidate model. |
| baseline_model_response | The response generated for the prompt by baseline model. |
| pairwise_choice | The model with the better response. Possible values are CANDIDATE, BASELINE or TIE. |
| explanation | The judge model's reason for the choice. |
Aggregate results
| Column | Description |
|---|---|
| candidate_model_win_rate | Ratio of time the judge model decided the candidate model had the better response to total responses. Ranges between 0 to 1. |
| baseline_model_win_rate | Ratio of time the judge model decided the baseline model had the better response to total responses. Ranges between 0 to 1. |
Computation-based metrics
Instance-level results
| Column | Description |
|---|---|
| response | The model's response being evaluated. |
| reference | The reference response. |
| score | The score is calculated for each pair of responses and references. |
Aggregate results
| Column | Description |
|---|---|
| mean score | Average score for all instances. |
| standard deviation | Standard deviation for all the scores. |
Examples
The examples in this section demonstrate how to read and understand the evaluation results.
Example 1
In the first example, consider evaluating a pointwise evaluation instance for TEXT_QUALITY. The score from the pointwise evaluation of TEXT_QUALITY metric is 4 (from a scale 1 to 5), which means the response is good. Furthermore, the explanation in the evaluation result shows why the judge model thinks the prediction deserves the score 4, and not a score that's higher or lower.
Dataset
prompt: "Summarize the following text in a way that a five-year-old can understand: Social Media Platform Faces Backlash Over Content Moderation Policies\nA prominent social media platform finds itself embroiled in controversy as users and content creators express discontent over its content moderation policies. Allegations of biased censorship, inconsistent enforcement, and suppression of certain viewpoints have sparked outrage among users who claim that the platform is stifling free speech. On the other hand, the platform asserts that its policies are designed to maintain a safe and inclusive online environment. This controversy raises broader questions about the role of social media in shaping public discourse and the responsibilities of platforms in curating online content."response: "People are upset with a website because they think it's not being fair with what people can post. Some people say the website is stopping them from saying what they want. But the website says it's trying to keep everyone safe. This makes people wonder if websites should control what people can say online."
Result
score: 4,explanation: The summary in response follows the instruction to summarize the context in a way that a five-year old can understand. It is grounded in the context and provides important details in its summarization. However, the language used in the response is a bit verbose.
Example 2
The second example is a pairwise comparison evaluation on PAIRWISE_QUESTION_ANSWERING_QUALITY. The pairwise_choice result shows the candidate response "France is a country located in Western Europe." is preferred by the judge model compared to the baseline response "France is a country." to answer the question in the prompt. Similar to pointwise results, an explanation is also provided to explain why the candidate response is better than the baseline response (candidate response is more helpful in this case).
Dataset
prompt: "Can you answer where France is based on the following paragraph? France is a country located in Western Europe. It's bordered by Belgium, Luxembourg, Germany, Switzerland, Italy, Monaco, Spain, and Andorra. France's coastline stretches along the English Channel, the North Sea, the Atlantic Ocean, and the Mediterranean Sea. Known for its rich history, iconic landmarks like the Eiffel Tower, and delicious cuisine, France is a major cultural and economic power in Europe and throughout the world."response: "France is a country located in Western Europe.",baseline_model_response: "France is a country.",
Result
pairwise_choice: CANDIDATE,explanation: BASELINE response is grounded but does not fully answer the question. CANDIDATE response, however, is correct and provides helpful details on the location of France.
What's next
Try an evaluation example notebook.
Learn about generative AI evaluation.