The Spend Reports dashboard is a cost management tool to help you understand the costs that reconcile to your invoice. The dashboard displays a detailed view of your costs for an invoice in a date range that includes the SKU description. You can also export the report in the dashboard to a comma separated values (CSV) file.
To get the permissions that you need to view the Invoice Reports dashboard, ask
your Organization IAM Admin to grant you the corresponding project viewer role
for the platform-obs project.
To access the Spend Reports dashboard and get an invoice using the kubectl
CLI, work through the following steps:
Console
- Sign into the GDC console.
- In the navigation menu, select Billing > Reports. The Billing reports page opens.
- In the Spend Reports section, click View dashboard to open the Spend reports dashboard.
CLI
Get your invoice:
kubectl get invoice -n billing-system
The Spend Reports dashboard consists of the following tables and graphs:
Spend Reports Table
The Spend Reports Table is a table that presents a detailed view of your costs for an invoice. The Spend Reports Table displays the following columns:
| Column | Description |
|---|---|
| Invoice ID | The unique ID of the invoice from a specific invoice_line_item. |
| Billing Account ID | Your GDC account ID number. |
| SKU | The description of what the SKU represents. |
| SKU ID | The ID number of the SKU. |
| Usage start date | The first day of the month when starting a specific invoice_line_item. |
| Usage end date | The final day of the month when ending a specific invoice_line_item. |
| Unit price ($) | The cost per quantity in United States Dollar (USD) amount. For example, the unit price for Compute depends on the amount of servers you used. |
| Usage amount | The amount of each unit you used. |
| Usage unit | The type of unit you used. |
| Cost | The total cost of each SKU by line. |
Total Cost by Product Family
The Total Cost by Product Family table presents a detailed view of your costs for an invoice. The Total Cost by Product Family table displays the following columns:
| Column | Description |
|---|---|
| Invoice ID | The unique ID of the invoice from a specific invoice_line_item. |
| Billing Account ID | Your GDC account ID number. |
| Payment Account ID | The ID of your organization payment account. |
| Product Family | The product group type. For example, compute. |
| SKU | The description of what the SKU represents. |
| SKU ID | The ID number of the SKU. |
| Cost | The cumulative cost of the specified product family SKU. |
Total Cost by Cloud Service Model
The Total Cost by Cloud Service Model table presents a detailed view of your costs for a product type. The Total Cost by Cloud Service Model table displays the following columns:
| Column | Description |
|---|---|
| Invoice ID | The unique ID of the invoice from a specific invoice_line_item. |
| Billing Account ID | Your GDC account ID number. |
| Payment Account ID | The ID of your organization payment account. |
| Cloud Service Model | The cloud service category. For example, IaaS |
| SKU | The description of what the SKU represents. |
| SKU ID | The ID number of the SKU. |
| Cost | The cumulative cost of the specified service model SKU. |
Cost by Month
The Cost by Month graph displays graphs of your costs in a monthly view. The Cost by Month graph informs you of how much your costs have increased or decreased in a month by month basis. The monitoring instance defaults the monthly view to All.
To customize the view by month, do the following:
- In the menu bar, set your preferred time range from the Timepicker drop-down.
- Select your preferred period of time.
Cumulative Total Cost
The Cumulative Total Cost graph scales your cumulative total cost in a given timeline.
Filter invoice data
You can filter values you see in the Invoice Reports dashboard through the menu bar. The menu bar lets you customize the values you see in the Invoices Table, Cost by Month and Cumulative Total Cost sections. The menu bar consists of the following tabs:
| Tab | Description |
|---|---|
| Invoice date | A drop-down that filters the Spend Reports Table and Total Cost (USD) column on your preferred date. |
| Billing Account ID | Your GDC account ID number. |
| SKU | A drop-down that lets you select which SKU to view. |
| Threshold (USD) | An input field you add in USD to cap the dollar amount of the Cumulative Total Cost graph. |
Export and print invoices
You can export an invoice to a portable document format (PDF) and print through the dashboard user interface.
To export an invoice to PDF and print, do the following:
- From the navigation menu, click the Dashboards icon.
- In the Billing folder, select the Spend Reports dashboard.
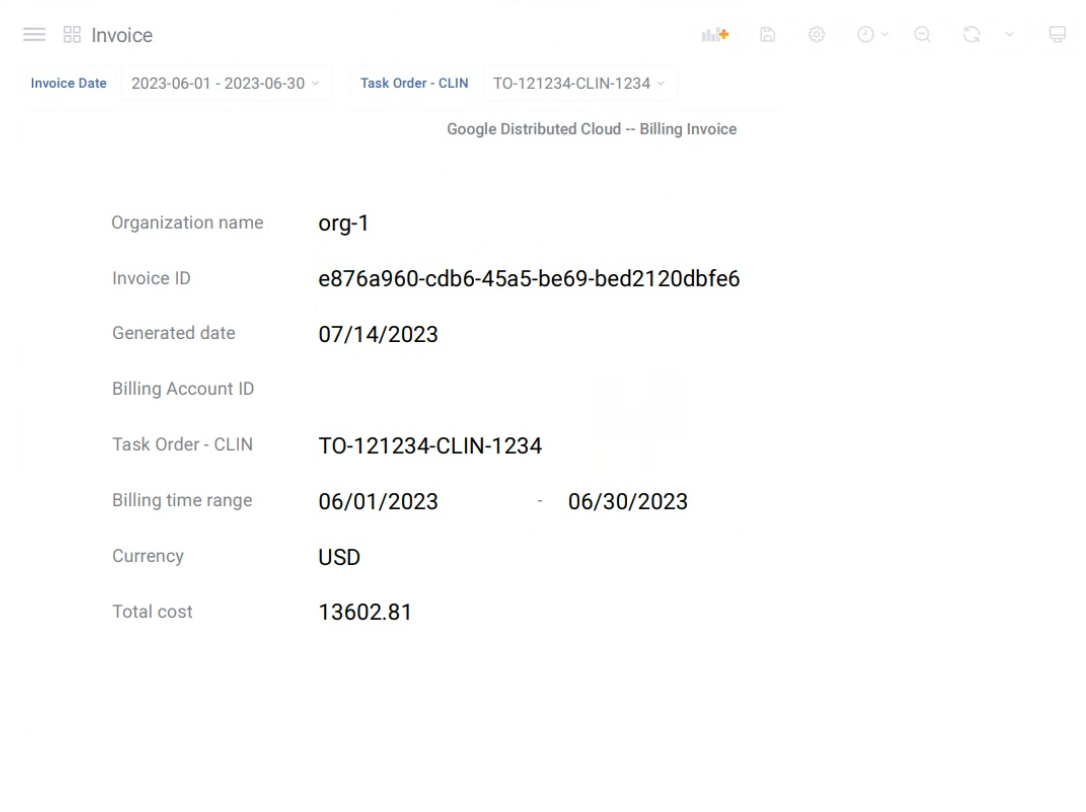
From the menu bar, select an invoice date from the Invoice Date drop-down, and a billing account ID number from the Billing Account ID drop-down. After selecting these values, the dashboard generates and auto-fills the following input fields:
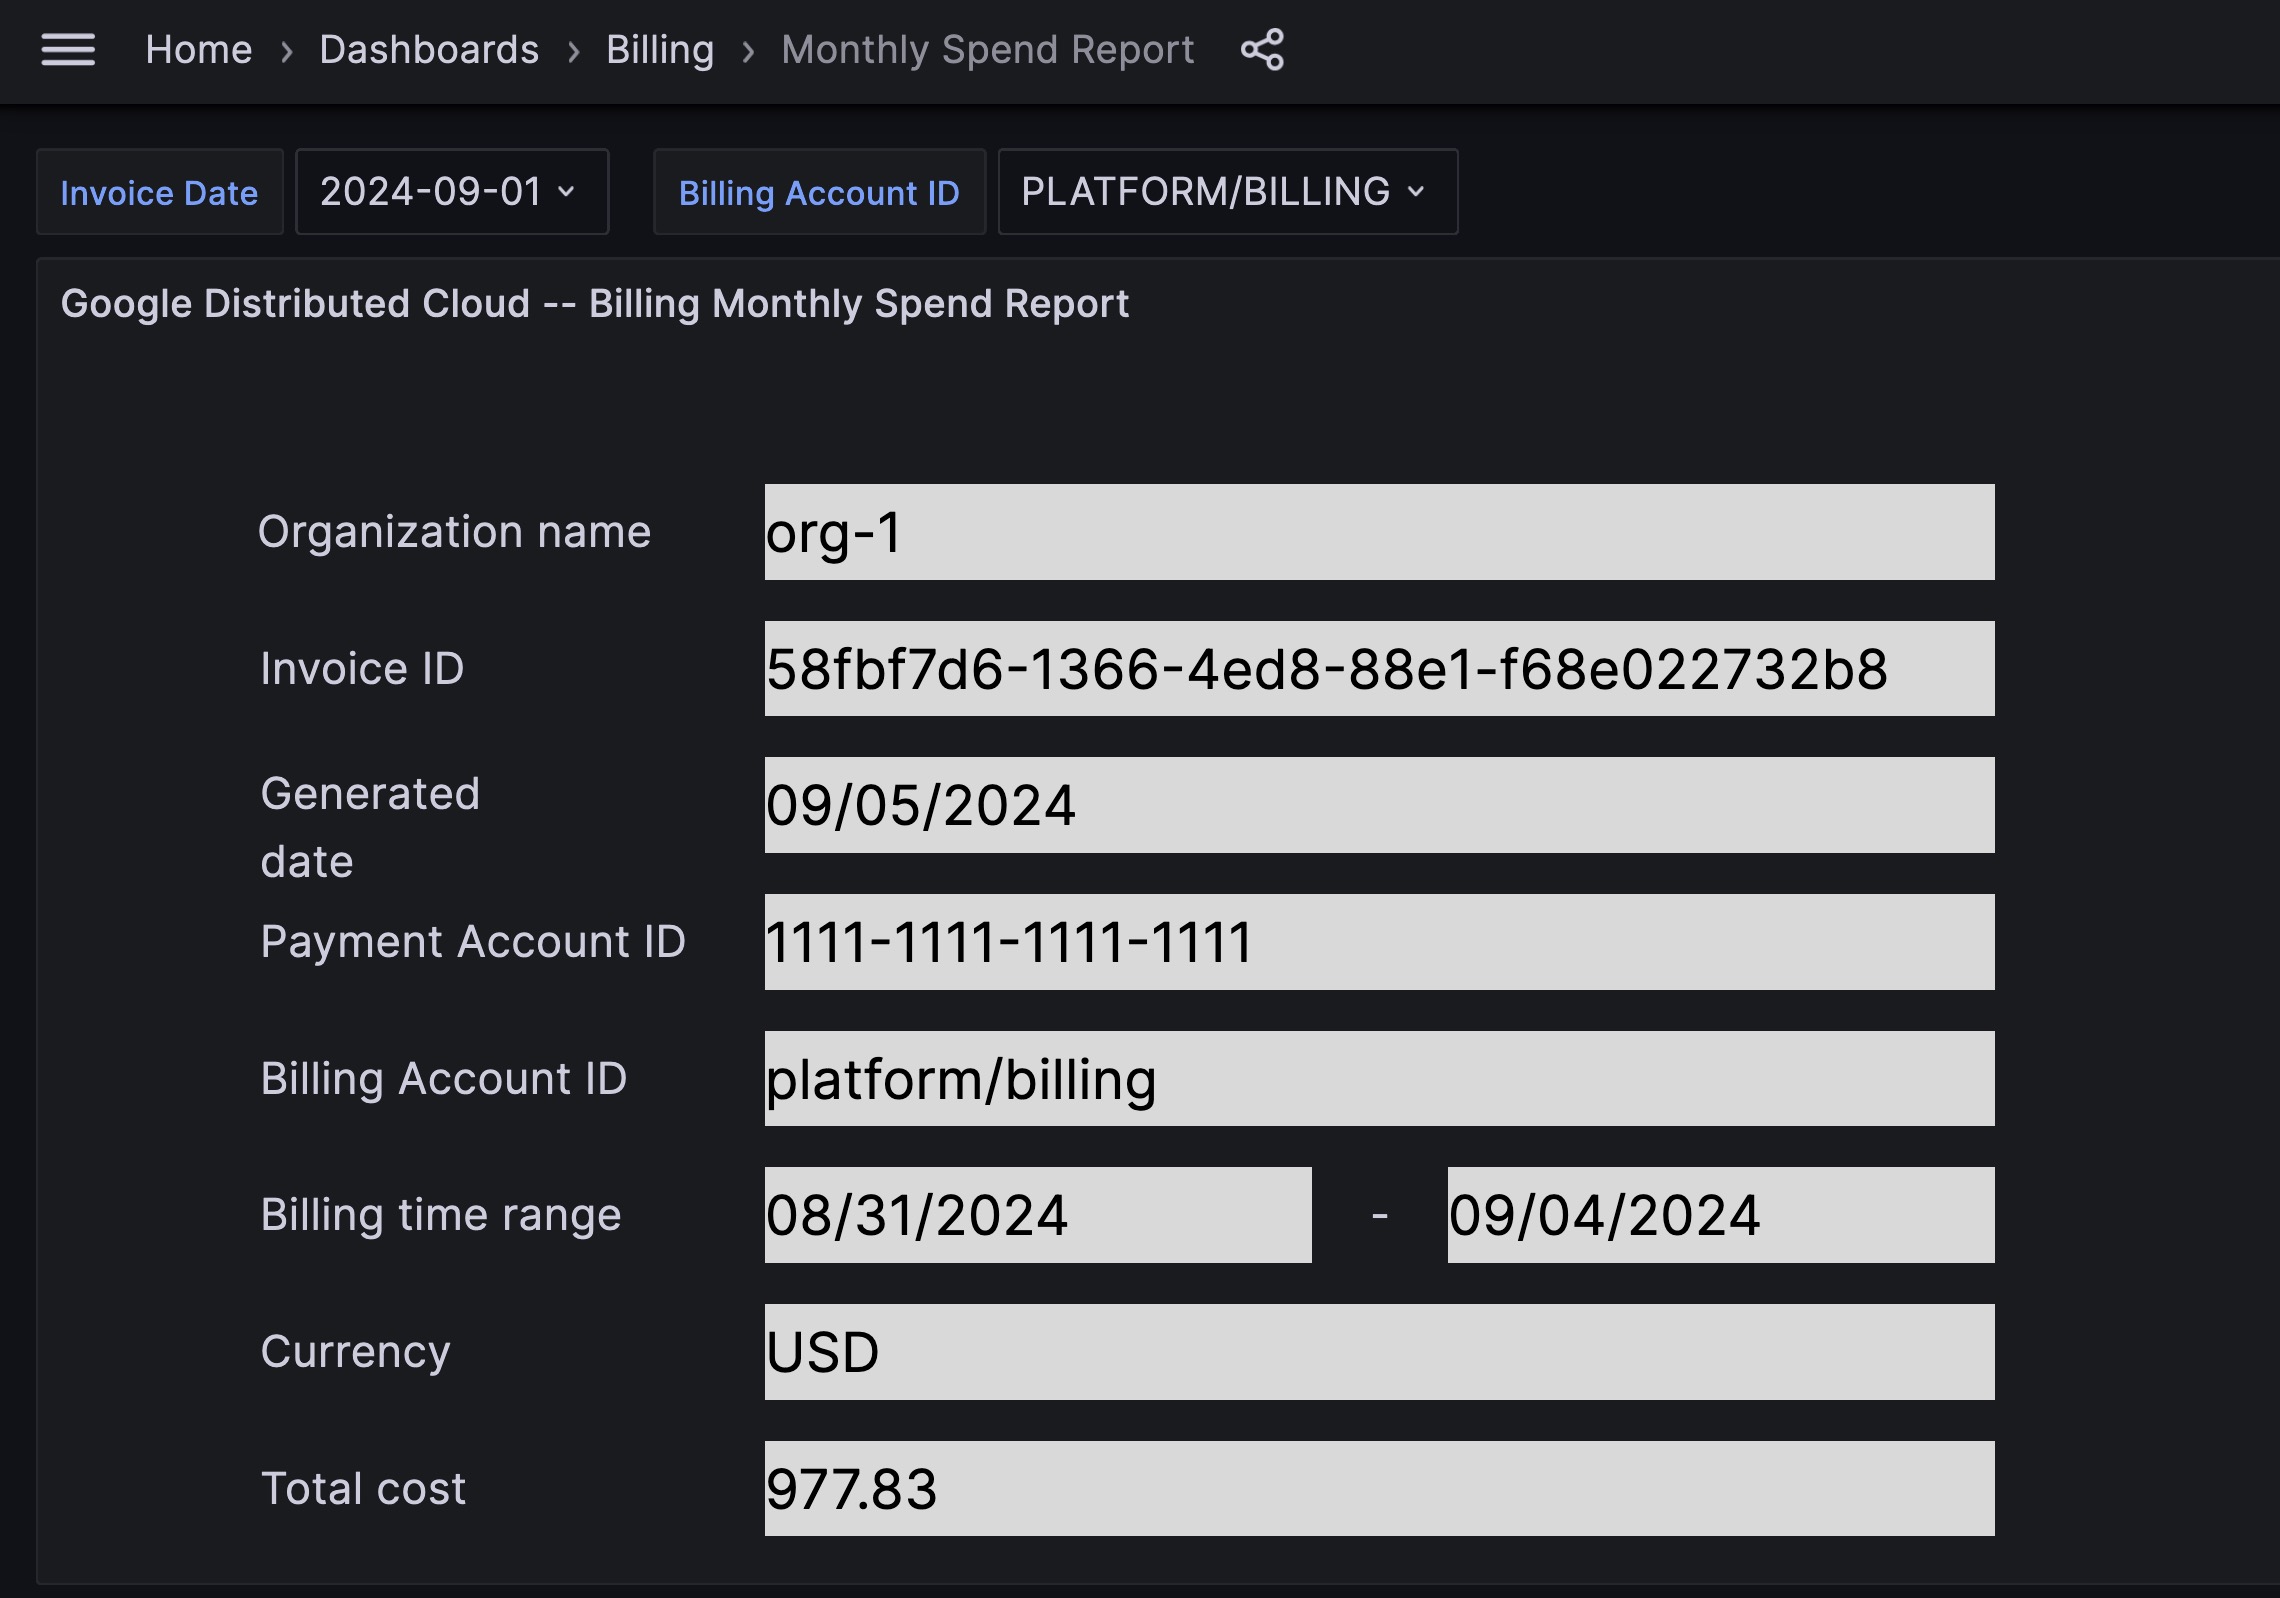
Input field Description Organization name The name of your organization. Invoice ID The ID of the invoice. Generated date The date when you created the exported invoice. Payment Account ID The ID of your organization payment account. Billing Account ID Your GDC account ID number. Billing time range The invoice dates you selected to export. Currency The asset type abbreviated by country. For example: USD. Total cost The cumulative costs of all SKUs in the invoice. From your keyboard, press
Vto preview the entire dashboard panel.Press
CTRL + PorCommand + Pto open your browser's default print setting.Select Save to PDF to save the invoice to an exported PDF file in your preferred directory. You can print this PDF file at any time.