Example: Add a new widget to a SOAR dashboard
Supported in:
The following procedure takes you through step-by-step instructions to add a new widget to a new dashboard. The widget displays a pie chart presenting products that have contributed to the top 5 attacks in all environments for the last 6 months (number of attacks in descending order). No filters are applied in this scenario.
- Click Dashboards from the main menu of the system located at the top of the user interface.
-
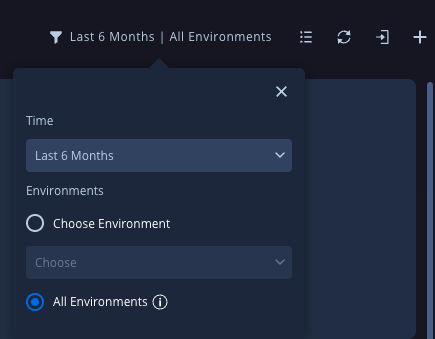
From the drop-down list at the top right of the screen, select the time as
Last 6 Months and the environment as All Environments.

-
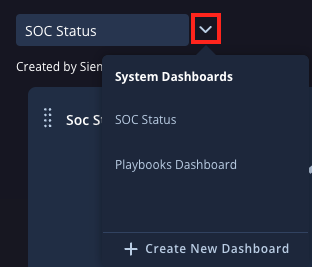
Click the arrow symbol next to the existing dashboard name located at the
top-left corner of the system and click Create New Dashboard.

- Type the new dashboard name as Attacks and click Create.
- In the new dashboard, click the plus symbol on the dashboard. The Widget Settings window appears.
- Type Top 5 Attacks by Products as the title.
- Choose a desired Widget Width by clicking on a radio button.
- In the left pane, by default, the data display is in the form of a Pie Chart. Retain it AS IS.
-
Select the following options for the Pie Chart fields below:
- Number of – Alerts
- Calculate field – Count
- Group by – Product
- Number of Results – 5
-
Order by – Descending
-
Click Save. The new widget is displayed on the dashboard named Attacks.
You can see the pie chart presenting products contributing to the top 5 attacks in all environments for the last 6 months.
Need more help? Get answers from Community members and Google SecOps professionals.
