This page applies to Apigee and Apigee hybrid.
View
Apigee Edge documentation.
![]()
This topic introduces Apigee API Analytics.
Improve your API through analytics
Apigee API Analytics collects and calculates a wealth of information that flows through API proxies. You can visualize this data with graphs and charts in the Apigee UI, or you can download the raw data for offline analysis using the Apigee APIs.
Analytics help you answer common questions, such as:
- How is my API traffic trending over time?
- Which API methods are most popular?
- Who are my top developers?
- When is API response time fastest? Slowest?
- Geographically, where do I see the most API traffic?
- How much revenue did your transactions generate?
You can analyze data for a specific Host name or for an entire environment.
The answers to questions like these help you improve your APIs, troubleshoot problems, and make better business decisions related to your API program.
API Analytics helps everyone improve
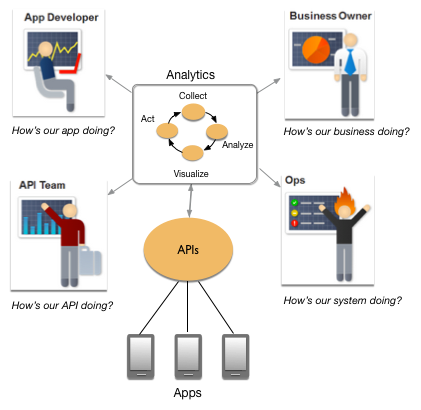
Through a continual process of collecting, analyzing, and visualizing data, Apigee API Analytics helps your API team improve their APIs and helps app developers improve their apps:

- API Team - The API team is tapping into internal systems to create interesting APIs. The API team wants to know how the API program is doing overall, how individual APIs are doing, and how to improve their APIs.
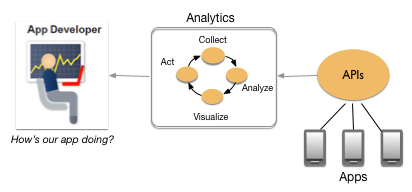
- App Developers - By sharing analytics information with app developers, you get better apps. These developers are innovating with your API and building creative apps that help drive revenue to your enterprise. Analytics help app developers know how their apps are doing and how much they are contributing to the bottom line of your enterprise. App developers want to know how they can improve their apps.
- Ops Team - The operations team wants to understand traffic patterns and anticipate when to add backend resources or make other critical adjustments.
- Business Owner - The business owner wants to see how their API investment is paying off and where to invest API dollars in the future.
How do I get started with Apigee API Analytics?
The type of Apigee organization you use will determine the steps required to get started with Apigee API Analytics. If you are unsure whether you are using a Subscription or Pay-as-you-go Apigee organization, contact your Apigee organization administrator.
Use Apigee API Analytics with a Subscription organization
If you are an Apigee Subscription customer, access to Apigee API Analytics is included in your subscription entitlements and automatically enabled for each of your Apigee environments.
You can access analytics data for your Subscription organization using either the Apigee UI in Cloud console or the Apigee API. For more details, see How do I access my analytics data.
Use Apigee API Analytics with a Pay-as-you-go organization
If you are a Pay-as-you-go customer, you must enable Apigee API Analytics as a paid add-on in order to begin using analytics data. For more information on enabling the Apigee API Analytics add-on for your Intermediate or Comprehensive Apigee environments, see Manage the Apigee API Analytics add-on.
After the Apigee API Analytics add-on is enabled in your environments, you can access your analytics data and manage your Apigee API Analytics add-on using the Apigee UI in Cloud console, or the Apigee API. For more details, see How do I access my analytics data. Analytics data and add-on management is not available in the classic Apigee UI for Pay-as-you-go orgs.
What kind of data is collected and analyzed?
Apigee API Analytics collects and analyzes a broad spectrum of data that flows across API proxies such as:
- Response time
- Request latency
- Request size
- Target errors
- API product name
- Developer email address or AppGroup Id
- App name
- Transaction revenue
For a complete listing of data collected by API Analytics, see Analytics metrics, dimensions, and filters reference.
How do I collect custom analytics data?
Apigee natively collects a wealth of data. You might also want to collect custom analytics data specific to your API proxies, apps, products, or developers. For example, you might want to gather analytics data from query parameters, request headers, request and response bodies, or variables that you define in your APIs.
You can collect custom analytics data with the DataCapture policy, and then use the analytics UI or API to examine the collected data.
When and for how long is my analytics data available?
There are two time intervals that control when and for how long you can view your analytics data:
- Data delay interval - After a call is made to an API proxy, it can take up to 10 minutes for the data to be accessible for display or through API calls.
- Analytics availability - The length of time that analytics data (which includes Monetization and Sense data, if applicable) is made available by Apigee differs by plan. Depending on your plan, analytics data may be available for the past 30 days, 90 days, or 14 months.
Analytics retention when using the Apigee API Analytics add-on
If you have a Pay-as-you-go organization, you can enable the Apigee API Analytics add-on at an environment level. Once the add-on is enabled for an environment, analytics data for the environment is retained for 14 months. You can access the environment's historic analytics data from the API Metrics page in the console as long as the add-on is enabled.
If you disable the Apigee API Analytics add-on for an environment in a Pay-as-you-go organization, the analytics data for the environment is deleted after 30 days. If you re-enable the add-on in the same environment within 30 days of disablement, you can regain access to analytics data for the environment through the retention period of 14 months. No data is restored if the add-on is re-enabled for the environment after 30 days.
If you want to retain analytics data for any environment in a Pay-as-you-go organization beyond the 14-month retention period, we recommend that you export and save your data in another location. You may also want to export your Analytics data before disabling the Apigee API Analytics add-on, or within the 30-day window after disablement. For more information, see Exporting data from Analytics.
Where is my analytics data stored and processed?
Where your analytics data is stored and processed is determined by your analytics region, which you specified when you installed Apigee:
- If you are a Subscription customer and installed Apigee using the Apigee provisioning wizard, you specified your analytics region in Create an organization step 1, when you set the Analytics hosting region.
- If you are a Pay-as-you-go customer and installed Apigee using the Google Cloud console, you specified your analytics region in Create an organization step 3, when you set the Analytics hosting region.
- If you installed Apigee from the command line as a Subscription or Pay-as-you-go customer, you specified your analytics region when
you defined the
environment variable
ANALYTICS_REGION. - If you installed Apigee with the
on-click option, your analytics data is stored in the
us-west1region. You cannot change this default location.
Analytics data is stored and processed as follows:
- For analytics regions not in the US or the EU, analytics data is stored and processed in the analytics region.
- For analytics regions in the US or EU, data is stored in the US or EU multi-region, respectively, for higher availability.
How do I access my analytics data?
Apigee API Analytics provides data visualization tools built into the Apigee UI. These tools include predefined analytics dashboards and custom reports that display data in graphs and charts and let you drill down to see data grouped into different dimensions (such as by API proxy, IP address, or HTTP status code).
You can also download analytics data using the Apigee API. Once downloaded, you can import that data into your own data visualization tools or analytics system.
Analytics dashboards
The Apigee UI provides a set of predefined dashboards that you can use to view analytics data.
Apigee in Cloud console
To open the Analytics dashboards (for Pay-as-you-go or Subscription organizations):
- Open the Apigee UI in Cloud console in a browser.
- Select Analytics > API metrics.

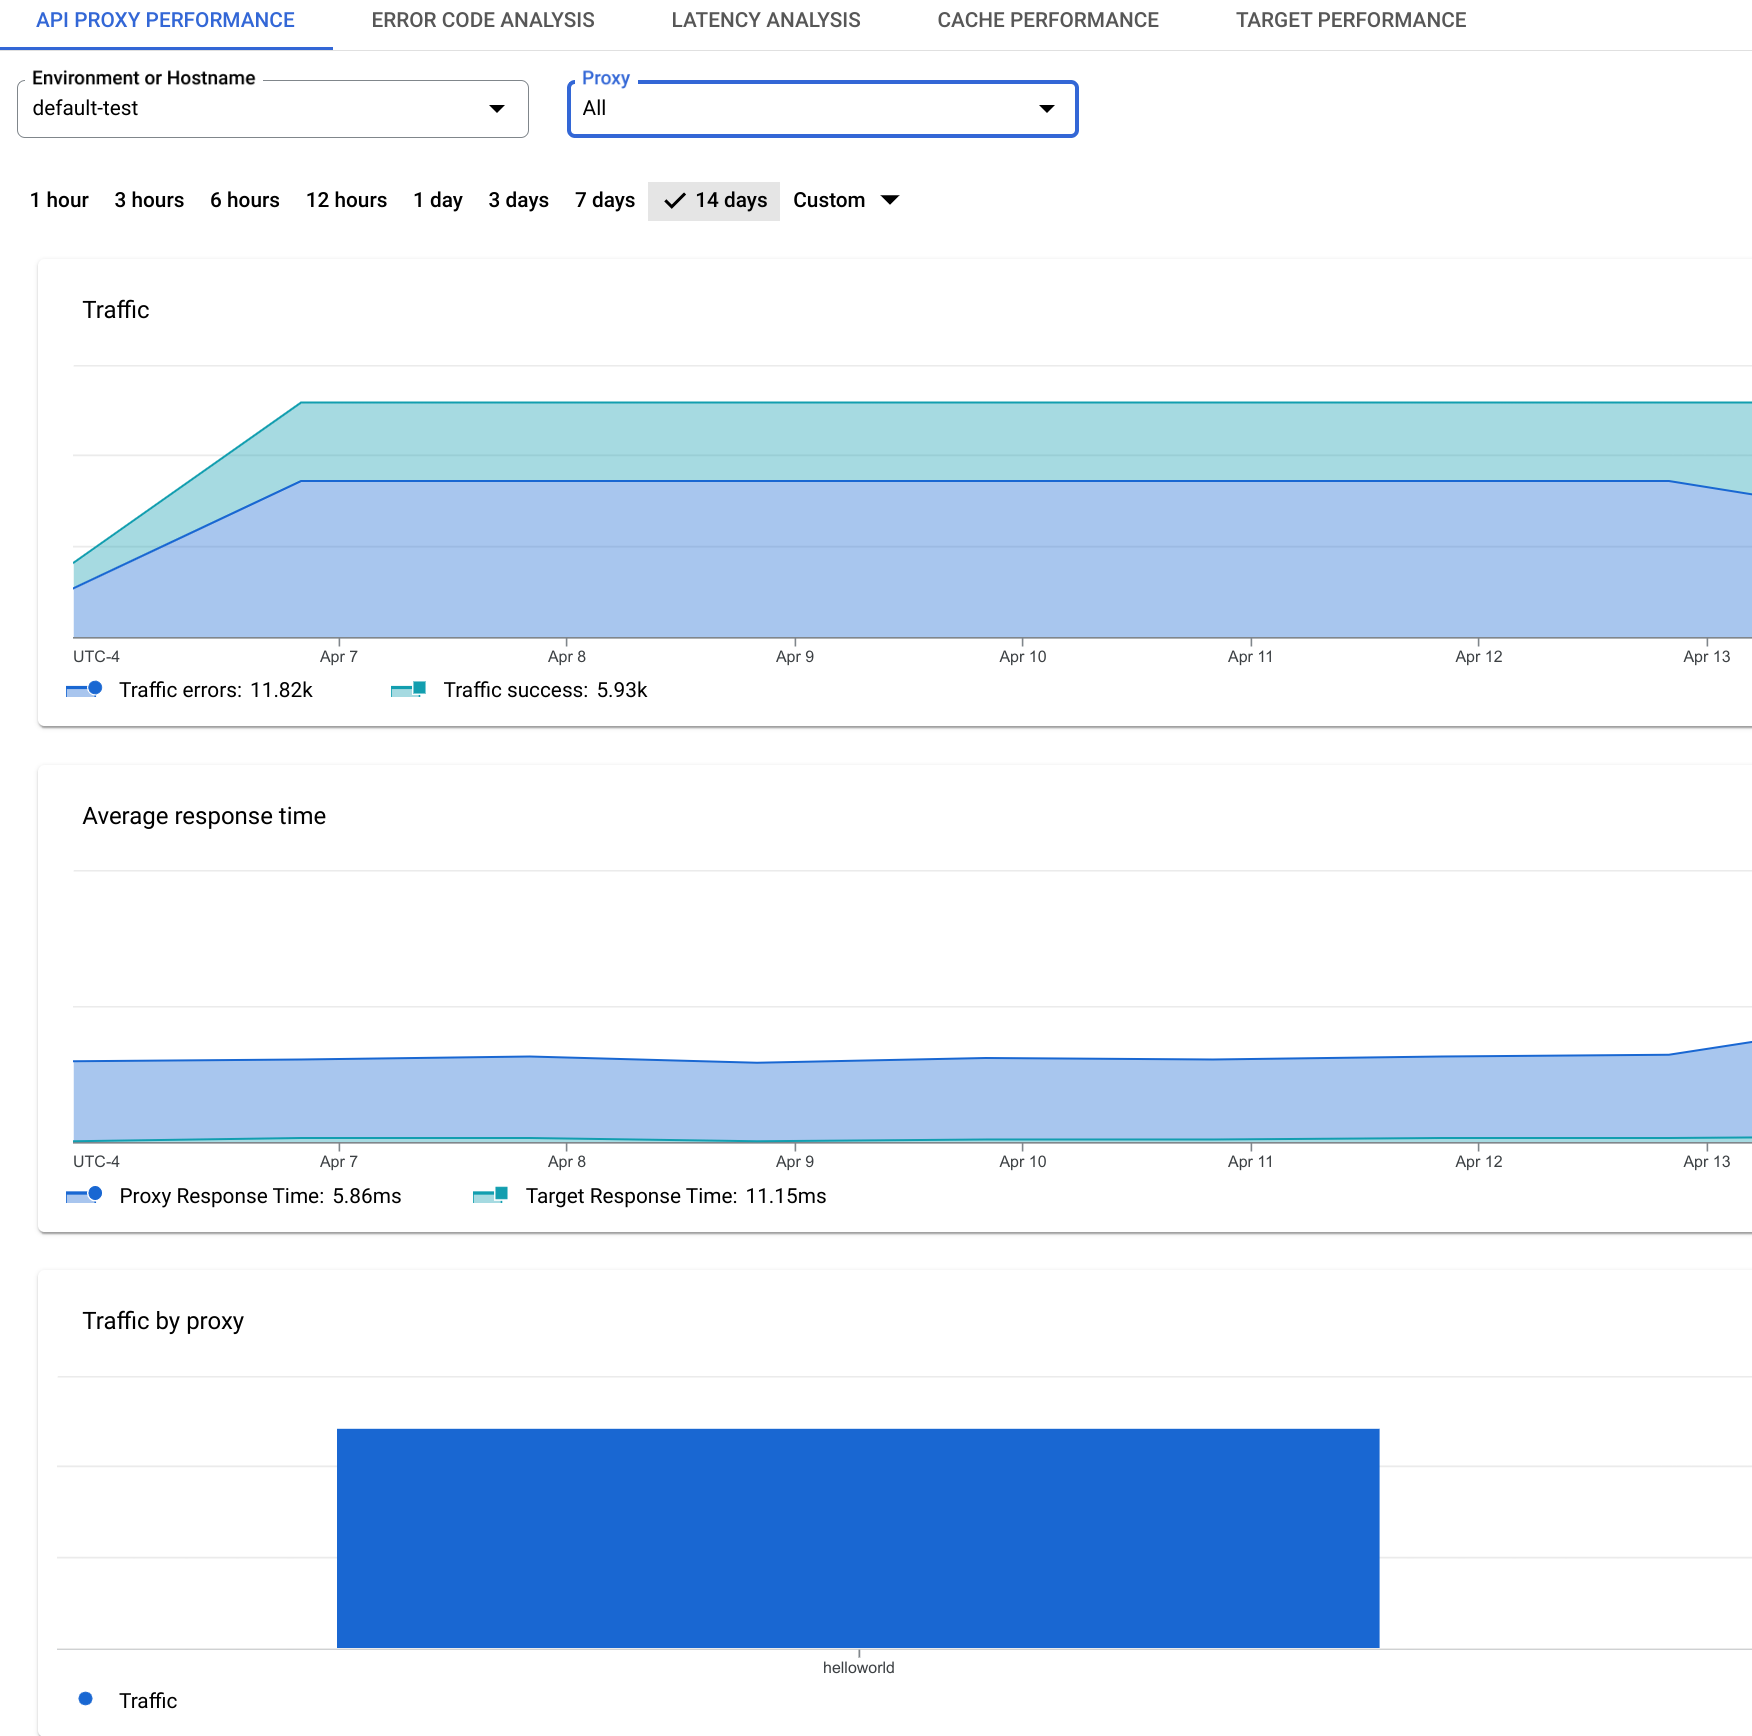
Select from the following tabs to view the dashboards:
For more information, see Using the analytics dashboards.
Custom reports
Custom reports let you drill-down into specific API metrics and view the exact data that you want to see. You can create a custom report using any of the analytics data built into Apigee.
When building a custom report, you select the data you want to see (metrics), group the data in meaningful ways (dimensions), and optionally limit the data returned based on specific characteristics of the data (filtering).
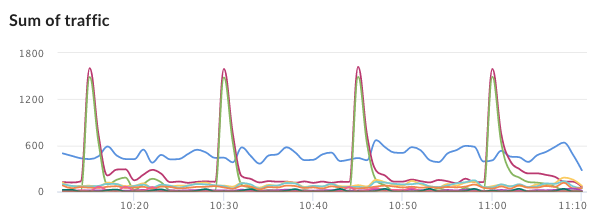
You can also set the chart type displayed in the custom report as a column or line chart. The following images show chart examples for transactions per second grouped by API proxy:
Column - Each API proxy is represented by a different column:

Line - Each API proxy is represented be a different line:

For more, see Creating and managing custom reports.
Analytics API
Use the Apigee API to download analytics data. For example, you can use the API to build your own visualization tools that you can embed in portals or custom apps.
Here's an example API call to retrieve analytics data for API proxies:
curl "https://apigee.googleapis.com/v1/organizations/myorg/environments/test/stats/apiproxy?select=sum(message_count)&timeRange=6/24/2022%2000:00~6/25/2022%2023:59&timeUnit=hour" \
  -H "Authorization: Bearer $TOKEN"
This call returns:
- The sum of requests (message count) per API proxy
- For a 24 hour period
- Grouped by hour
The timeRange query parameter specifies the time period in the form:
?timeRange=MM/DD/YYYY%20HH:MM~MM/DD/YYYY%20HH:MM
Notice the %20 before HH:MM. The timeRange parameter requires
a URL-encoded space character before HH:MM, or a + character, as in:
MM/DD/YYYY+HH:MM~MM/DD/YYYY+HH:MM.
For more, see Using the metrics API.
Export analytics data to Google Cloud Platform
You can use the Apigee API to export all analytics data for an entire day from Apigee to your own data repository, such as Google Cloud Storage or BigQuery. You can then take advantage of the powerful query and machine learning capabilities offered by Google Cloud BigQuery and TensorFlow to perform your own data analysis.
For more, see Exporting data from Analytics.
How do I share data with app developers?
When you think of app developers as your customers, you'll want to make sure they have the tools and information available to them to make the best use of your API.

App developers are not only concerned about the quality of their apps, they are very interested in your APIs. The Drupal-based developer portal includes an optional App Performance page designed to give app developers access to important metrics for their apps. This page gives developers information about:
- Errors: Which API errors is my app seeing?
- Performance: Is the API slow? Which API methods are typically slow or slow right now?
- Availability: Is the API up or down?
- Quota: Does your API have a quota? And as the app developer, how am I doing against the quota?
For more information, see Monitor apps in the Drupal 8 documentation.
Additionally, you can share analytics with your developers by:
- Creating custom reports and sharing them with your app developers. For more information, see Creating and managing custom reports.
- Using the metrics APIs to capture data over a wider period of time to share with app developers offline. For more information, see Use the metrics API.
How do I generate complete analytics data?
What do we mean by complete analytics? You can, for example, create an API proxy and Apigee will collect analytics data about that proxy. But what about metrics for the developer or app that called the API proxy? If Apigee doesn't know who made an API call, it can't collect that data.
A few steps are required to let Apigee figure out which developers and which developer apps are calling your API proxies. Here is a list of those steps with links to more detailed information:
- Create one or more API products, which is a grouping of API proxies along with a service plan. See Managing API products.
- Registering app developers with Apigee. See Registering app developers.
- Registering apps and managing API keys for your developers. See Register apps and manage API keys.
- Add security policies to your API proxies that verify API keys and/or security tokens. See the following topics: VerifyAPIKey policy, OAuthV2 policy, and VerifyJWT policy.
The following tutorials guide you through the necessary steps that let you see analytics for developers and apps: Secure an API by requiring API keys and Secure an API with OAuth.
Apigee hybrid requirements
This section lists important information for Apigee hybrid users.
Support for data residency
- If you have a newly created Apigee hybrid v1.13.1 org with data residency enabled, follow the steps in Using data residency with Apigee hybrid.
- Clocks on all Synchronizer nodes should be in sync and in UTC.
Older versions of Apigee hybrid do not support Apigee API Analytics.
Other requirements
- You must have the
apigee-udcaservice account configured. See Specify configuration overrides. - Clocks on all Synchronizer nodes should be in sync and in UTC.
