This page applies to Apigee and Apigee hybrid.
View
Apigee Edge documentation.
![]()
What does this dashboard tell me?
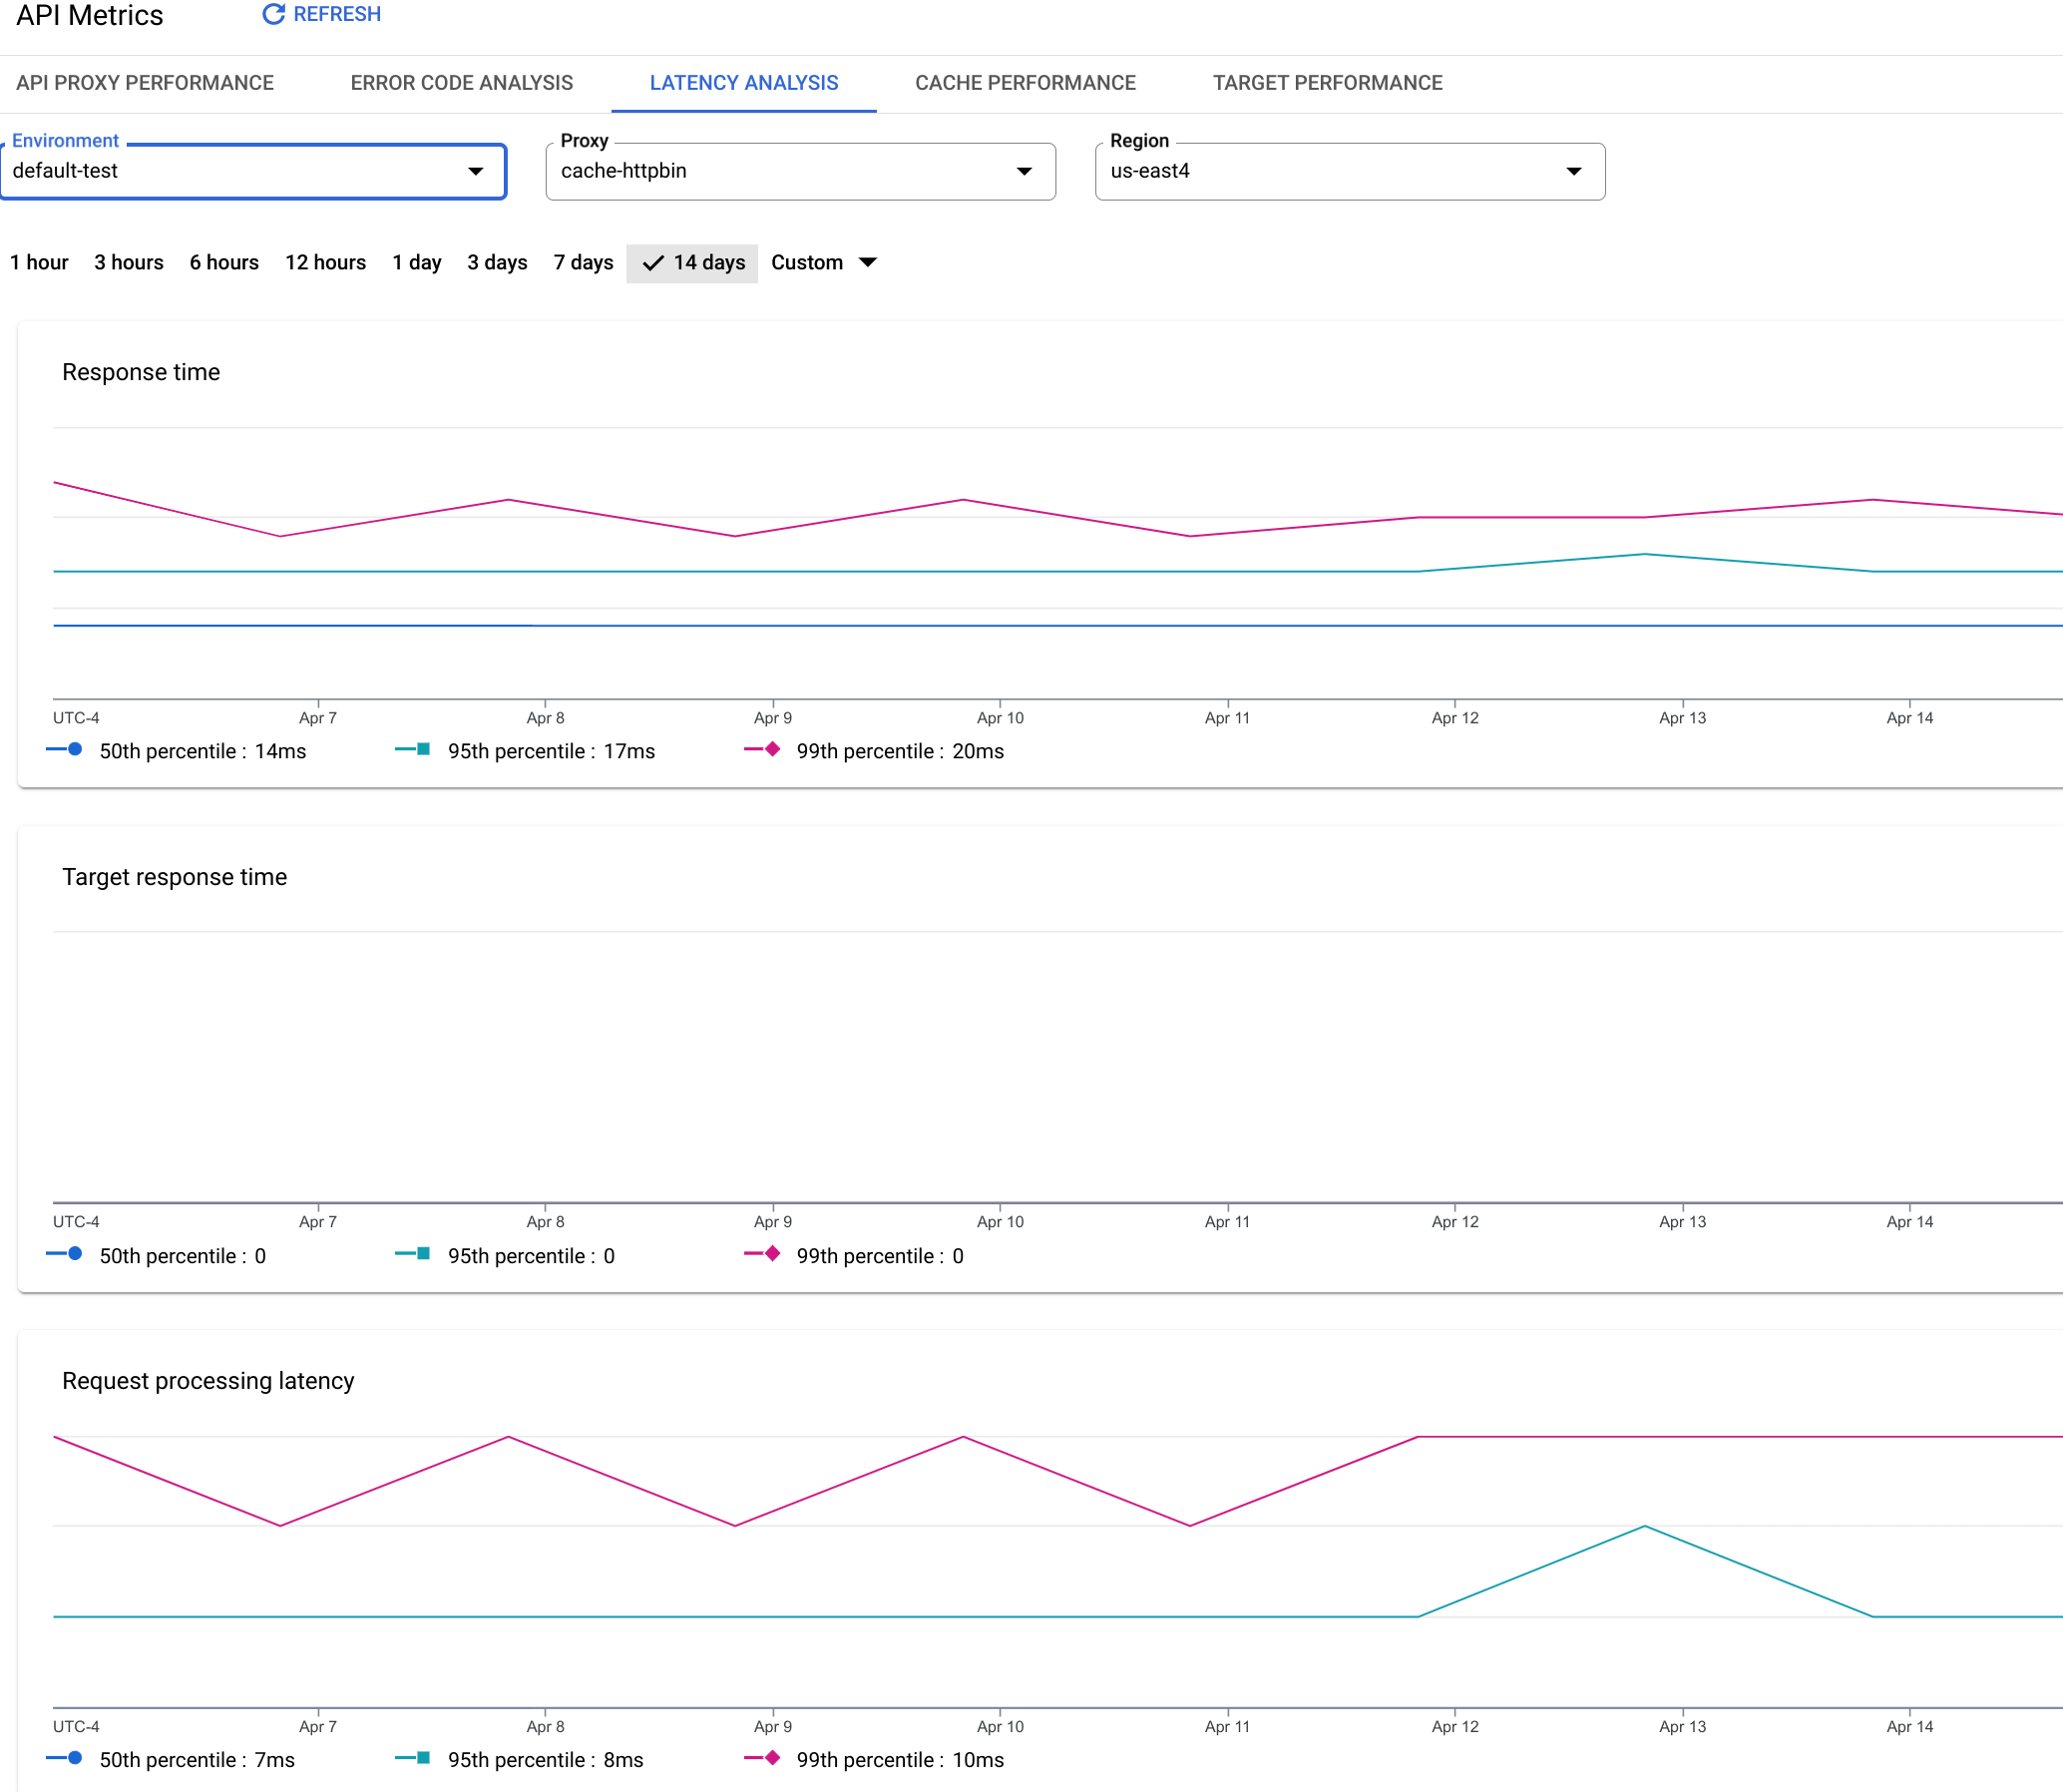
The Latency Analysis dashboard can alert you to any latency issues your API proxies may be experiencing. It displays latency measurements down to the window of a minute, highlighting the median, 95th percentile, and 99th percentile values.
The median value tells you the point at which half of your traffic is experiencing latency that is less than this value and half of your traffic is experiencing latency that is greater than this value. For example, if the median response time latency for your selected API proxy is 62 ms, it means that half of the responses from this API proxy take less than 62 ms. It also means that half of the responses from this API proxy take more than 62 ms.
The 95th percentile and 99th percentile values tell you the point at which 95% and 99% of your traffic is experiencing latency that is less than these values. Or rather more importantly, it can point out outlying behavior, telling you that 5% and 1% of your traffic is experiencing latency values that are out-of-range.
The Latency Analysis dashboard
To access the Latency Analysis dashboard:
- If you are using the Apigee UI in Cloud console: Select Analytics > API metrics and click the Latency Analysis tab.
- If you are using the classic Apigee UI: Select Analyze > API Metrics > Latency Analysis.
The Latency Analysis view is shown below (Cloud console version).

What does this dashboard measure?
See also this interesting article on the Apigee Community site: When can the Average Total Response Time be less than the Average Target Response Time?
| Metric | Description |
|---|---|
| Response Time | Total number of milliseconds it took to respond to a call. This time includes the Apigee API proxy overhead and your target server time. |
| Target Response Time | Number of milliseconds it took your target server to respond to a call. This number tells you how your own servers are behaving. |
| Request Processing Latency |
Number of milliseconds from the time when a call reaches the selected API proxy to the time when Apigee sends the call to your target server. Add the request and response latencies to calculate the final overhead the API proxy added to the call. |
| Response Processing Latency |
Number of milliseconds from the time when the API proxy receives your target server’s response to the time when Apigee sends the response to the original caller. Add the request and response latencies to calculate the final overhead the API proxy added to the call. |
