This page applies to Apigee and Apigee hybrid.
View
Apigee Edge documentation.

What does this dashboard tell me?
The Devices dashboard tells you about the devices and servers that are being used to access your APIs. It lets you spot trends in how users are accessing your APIs. For instance, you might notice that traffic from one type of device is increasing, while another is going down, and then decide if the change requires any action or not.
The Devices dashboard
To access the Devices dashboard:
- If you are using the Apigee UI in Cloud console: Select Analytics > End user analysis and click the Devices tab.
- If you are using the classic Apigee UI: Select Analyze > End Users > Devices.
The dashboard opens as shown below (Cloud console version):
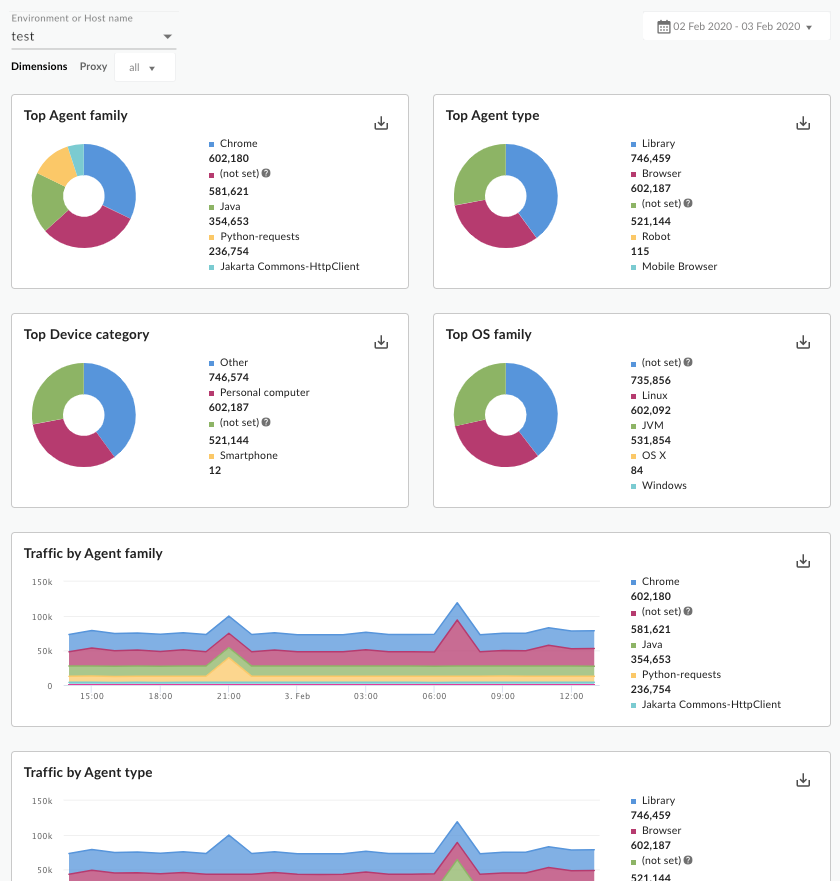
Using the Cloud Console version of the dashboard
The dashboard has a set of dropdown menus that you can use to filter the information shown in it. The filter dropdown menus are dynamic. For example, if you select an environment from the Environments dropdown, then any proxies, and hostnames associated with that environment are automatically selected in the other dropdown menus, charts, and tables. For more information, see About filter properties in the Looker Studio documentation.
Use the date selector to pick a start and end date to measure. The date selector only lets you select dates in day increments. You can't select a time range increment that is smaller than a day.
The graphs are interactive. Hover over a graph to see more details. Use the action menu in a graph for options like sorting and exporting data.
What does this dashboard measure?
In addition to the following metrics, the dashboard shows the top agents, agent types, device types, and OS families.
| Metric | Description |
|---|---|
| Traffic by user agent family | Measures how much traffic is coming from a specific application, like Google Chrome, Safari, Firefox, cURL, IE, and other agents. |
| Traffic by user agent type | Tells you if traffic is coming from a browser, a robot, a library, or other agents. |
| Traffic by device category | Tells you if traffic is coming from a PC, a mobile device, and other categories. |
What else do I need to know about this dashboard?
You can view data for all API proxies in your organization, or you can use the Proxies drop-down to select individual APIs to analyze. When traffic origination cannot be determined, it is recorded as "Others".
This dashboard uses standard controls, like the date and data aggregation selectors, hovering over graphs for more context, exporting data to CSV, and so on. To learn more, see Using the analytics dashboards.
Make a copy in Looker Studio
If you are using this dashboard in Google Cloud console, you can edit, save, and share a copy of the dashboard in Looker Studio. To get started:
- Click Make a copy in Looker Studio.
- From the dropdown menu, select the report you wish to copy.
- In Looker Studio, click Save and share.
- Click Acknowledge and save.
You can now edit the copy saved in your user account. For details on using Looker Studio to edit and create reports, see the Looker Studio documentation.