This page applies to Apigee and Apigee hybrid.
View
Apigee Edge documentation.

What you'll learn
In this tutorial, you'll learn to:
- See the response message's headers and body content.
- See error messages.
What you'll need
Before you begin this tutorial, do the following:
- Ensure that
curlis installed on your machine to make API calls from the command line. - Complete the steps in Before you begin.
- Add a SpikeArrest policy to your proxy. The SpikeArrest policy is a policy that restricts the number of requests that can be sent to your API proxy. Your proxy must have at least one policy.
View message data
The Debug view in the Apigee Proxy Editor lets you view headers, variables, objects, and other details such as response time in the API proxy request and response flow. The Debug view also lets you see how a request or response changes as it is processed by an API proxy. For a more detailed description of the debug view, see Using Debug.
This page describes how to use the Debug view to see what happens when the SpikeArrest policy rate is exceeded.
Cloud Console UI
Debug v2 (new)
To use the Debug view in the Cloud Console UI to see what happens when the SpikeArrest policy rate is exceeded:
- Open the Cloud Console UI.
- Select your project.
- Click Proxy development > API Proxies.
- Click the name of the API proxy you want to debug.
- Click the Develop tab.
- Click the Policies > SpikeArrest policy.
- In the edit pane, change Rate to 1pm.
- Click Save.This will allow you to see both successful and failed (over the limit) API calls.
- Deploy the updated proxy.
- Click the Debug tab.
- Click Start Debug Session.
In the dialog:
- Select the Environment in which you want to run the debug session.
-
(Optional) From the Filter drop-down list, select a filter to apply to all transactions in the debug session you are creating. The default is
None (All
                  transactions)
, which includes all transactions in the debug data.For information on using filters, see Using filters in a debug session. For information about the built-in filters, see Using predefined filters.
- Click Start.
-
Call the API proxy using
curl(or with the URL in a web browser) several times until you see at least one200response and one429response in the Transactions pane.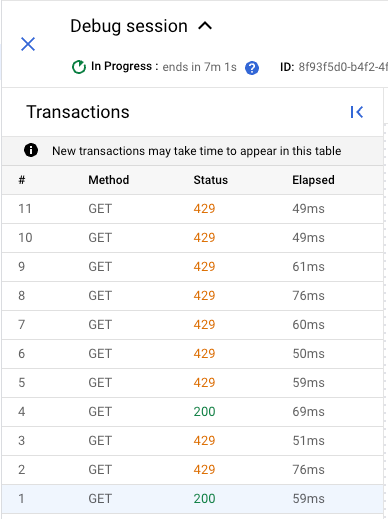
-
Click a
429transaction. In the Transaction map pane, this displays a flow diagram including a SpikeArrest policy with an error icon.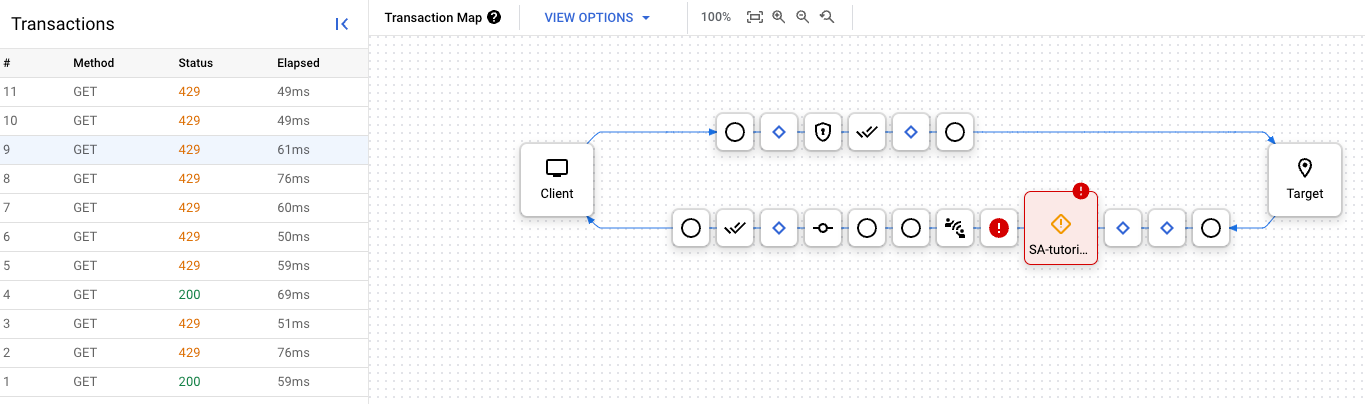
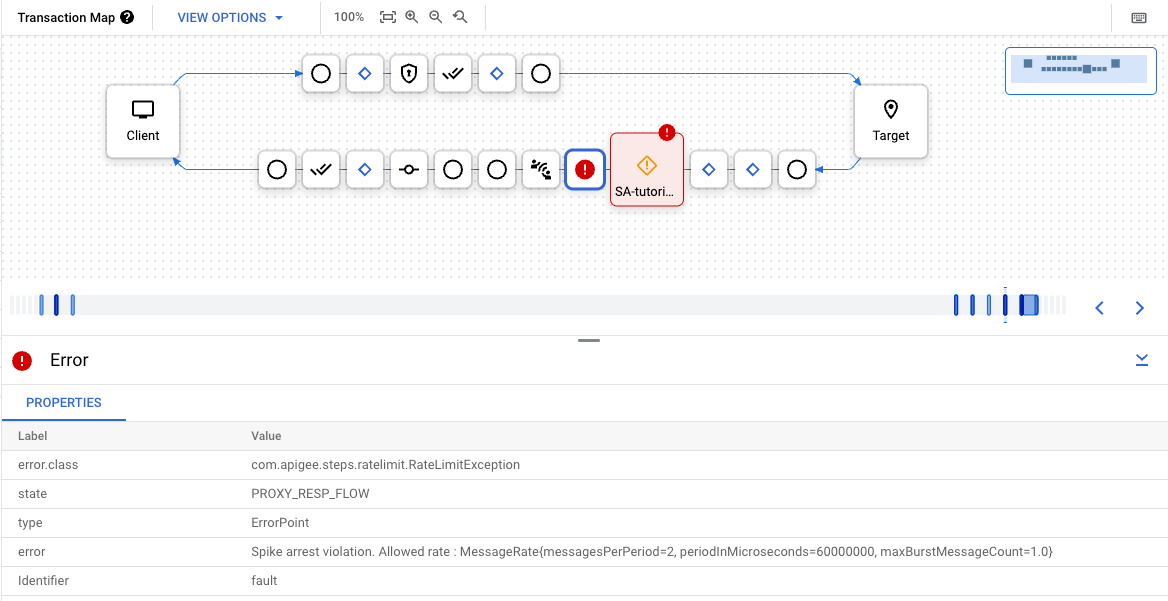
-
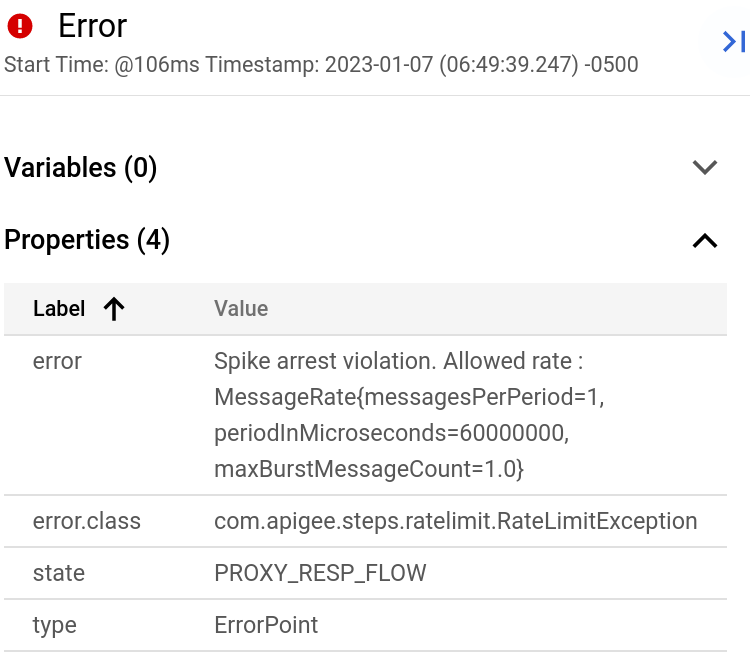
Click the error icon. The Error Properties pane is displayed.
You can click the Previous and Next buttons to move between steps in the flow and see the details of each step.
To download the entire debug session as a single document, click Download Session. A debug session is deleted within 24 hours of the time it is completed, so if you want to view the session after that time, you need to download it before then.
Debug v1
- On the Develop tab of the API Proxy, edit the Spike Arrest policy's
<Rate>to be 1pm again, then Save the proxy. This will allow you to see both successful and failed (over the limit) API calls. - In the Proxy Editor, click the Debug tab.
- Click Start Debug Session.
- Select the Environment in which you want to run the debug session.
- (Optional) From the Filter drop-down list, select a filter to apply to
all transactions in the debug session you are creating.
The default is
None (All transactions), which includes all transactions in the debug data.For information on using filters, see Using filters in a debug session. For information about the built-in filters, see Using predefined filters.
- Click Start.
-
Call the API proxy again using
curl(or with the URL in a web browser) several times until you see at least one200response and one429response in the left-hand pane.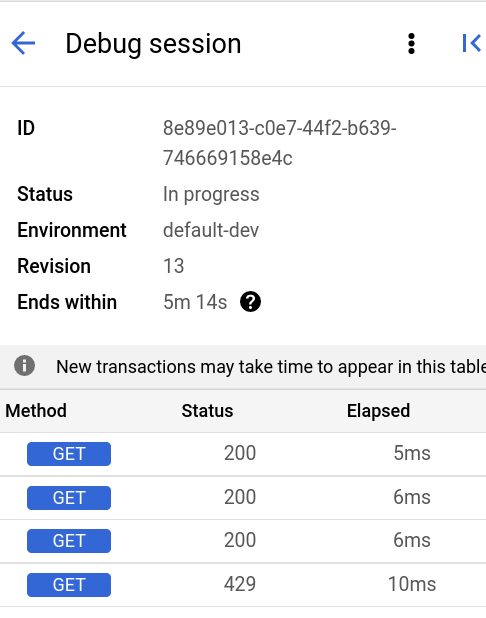
- Click the
429transaction in the left-hand pane. This displays a Gantt chart for the transaction in the right-hand pane.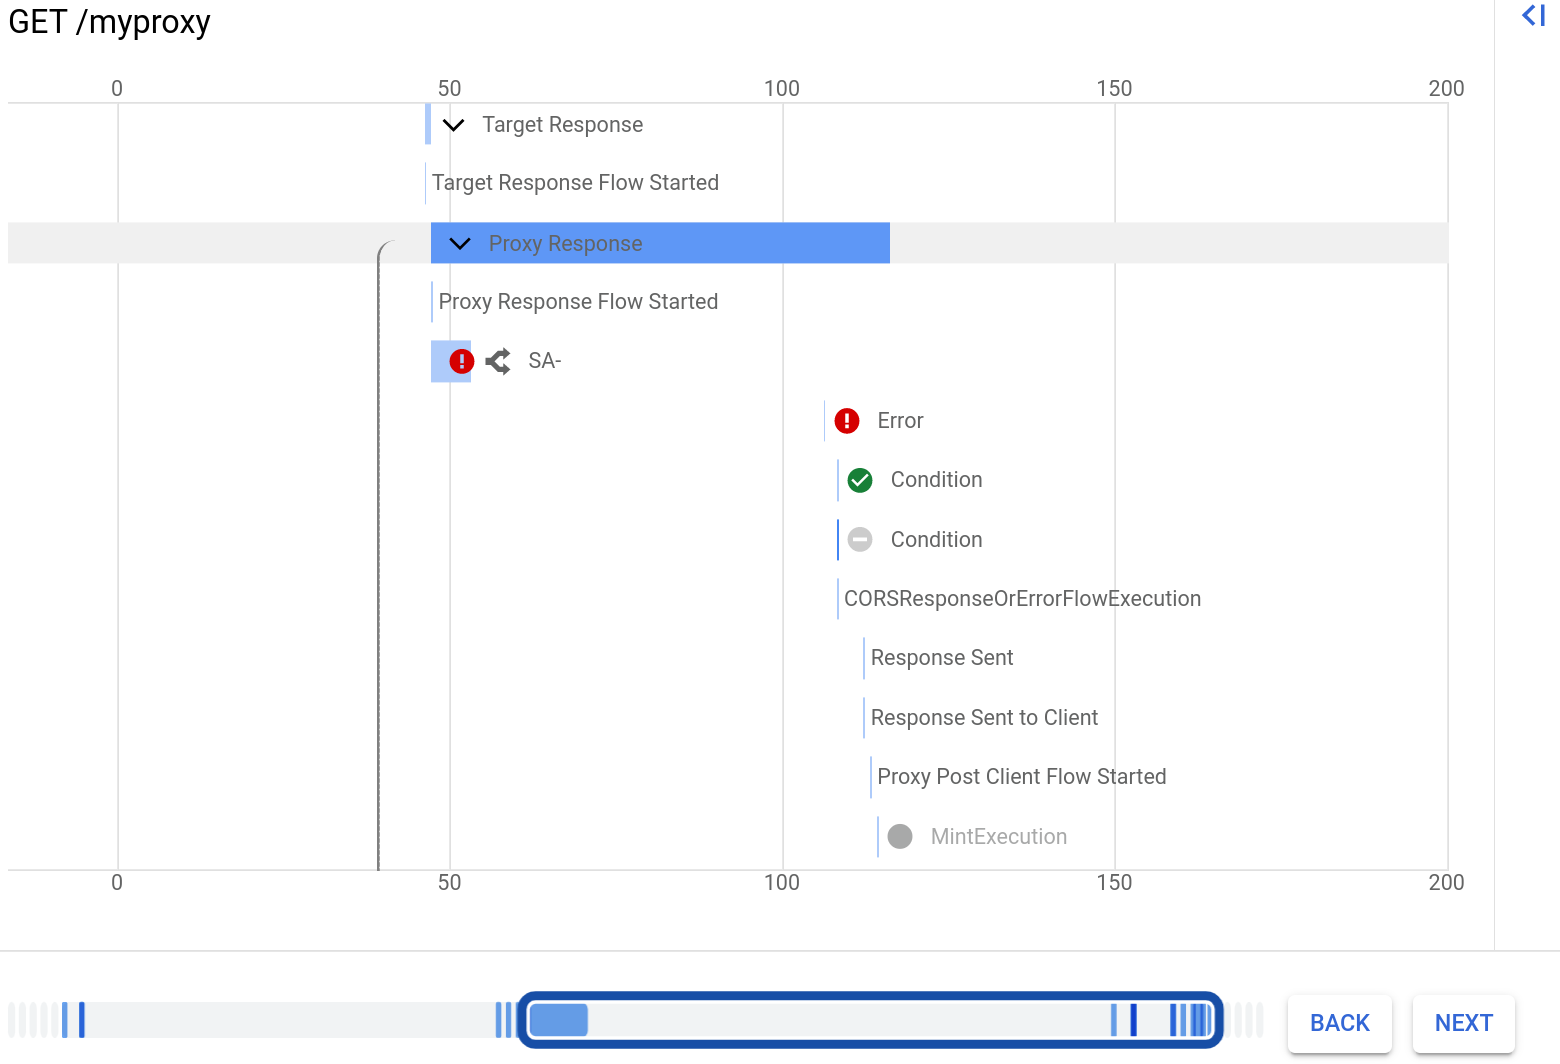
Note that there is a row for the Spike Arrest policy, which is displayed with an error icon.
Click the row labeled Error. This displays the error details to the right of the chart. The picture below shows the Properties section of the error details:
In the dialog:
You can click the Back and Next buttons below the Gannt chart to move between steps in the flow and see the details of each step.
To download the entire debug session as a single document, click Download Session. A debug session is deleted within 24 hours of the time it is completed, so if you want to view the session after that time, you need to download it before then.
Classic UI
- On the Develop tab of the API proxy, edit the Spike Arrest policy's
<Rate>to be 1pm again, then Save the proxy. This will allow you to see both successful and failed (over the limit) API calls. - In the Proxy Editor, click the Debug tab.
- Under Start a debug session, select the environment to which your proxy is deployed.
- Click Start Debug Session.
-
Call the API proxy again using
curl(or with the URL in a web browser) until you see at least one200response and one429response in the Debug Transactions pane.curl -v https://YOUR_ENV_GROUP_HOSTNAME/my-proxy
where
YOUR ENV_GROUP_HOSTNAMEis the environment group hostname. See Find the environment group hostname.A
200response and a429response are shown below.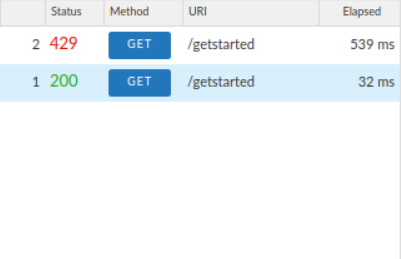
- Click the
200transaction in the left Transactions pane. Its Debug detail is loaded in the main window under Transaction Map, which shows a request/response diagram. The Spike Arrest icon is in the request flow. - In the flow diagram, click the circle icon in the response, the
furthest one to the right (shown in the following diagram).
The Phase Details pane shows the data available at that point in the flow. If you scroll through that pane, you'll see the HTTP response headers and body content.
- Now look at an error in Debug.
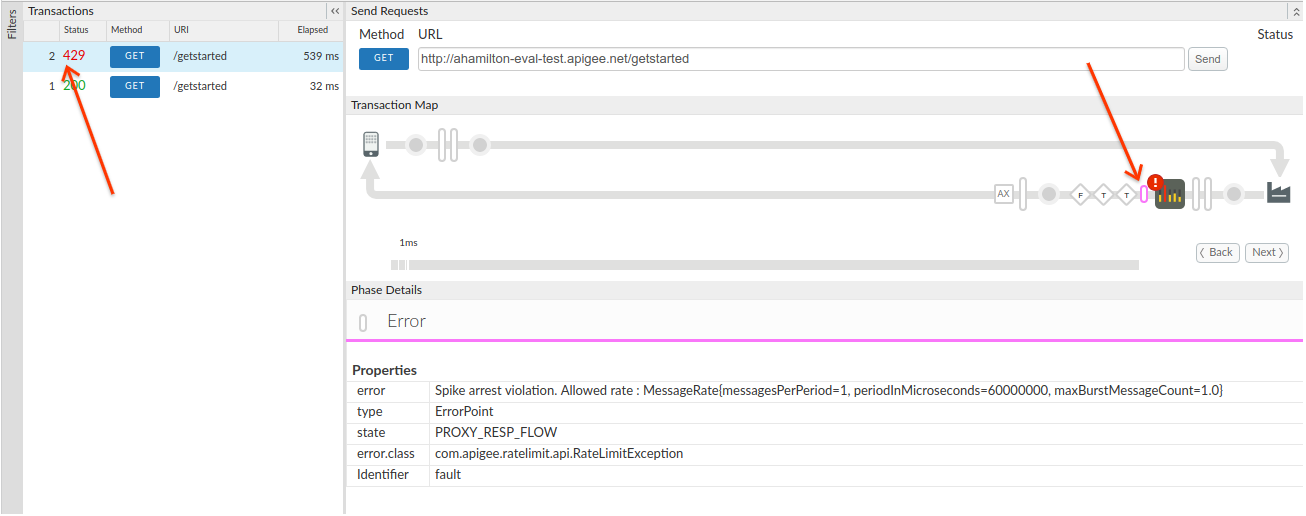
Click the
429transaction in the Transactions pane. In the main editor window, you see a flow diagram with items in the request only, including a Spike Arrest icon with a red exclamation point indicating an error.Click the small tube-shaped error icon to the right of the Spike Arrest icon, and look at the spike arrest violation details in the Phase Details pane.
You can click the Back and Next buttons in the flow diagram to move between points in the flow and see the Debug details.
If you want to see the entire Debug session as a single document, download it by clicking Download Debug Session.
For more information, see Using Debug.